This guidance highlights the differences between the Scotland figures within the UK House Price Index (HPI) and our house price statistics.
For more information about how we compile our statistics, see our guidance notes.
A guidance document comparing different house price indices in the UK is available.
Summary
The headings below provide an overview of the differences between the methodology and content of the HPI and the methodology and content of the quarterly statistics.
Frequency of publication
House Price Index: Monthly
RoS house price statistics: Monthly, quarterly, calendar year and an annual report based on financial year.
Base data source
House Price Index: Applications for registration of residential sales in the land register, plus house types derived using RoS methodology and base mapping data (Ordnance Survey ©Addressmap)
RoS house price statistics: As above.
Date range of extraction
House Price Index: Based on the date of entry to the property for each calendar month.
RoS house price statistics: Based on the month that applications are received for registration in the land register.
Price range
House Price Index: All market value sales.
RoS house price statistics: Median house price statistics include all market value sales; Mean house price statistics include sales between £20,000 and £1 million.
Average house prices
House Price Index: Based on geometric mean – sub-Scotland local authority figures will be based on three-monthly moving averages to reduce volatility.
RoS house price statistics: Based on arithmetic mean and median.
Case mix adjustment
House Price Index: Yes – based on room numbers provided via EPC data.
RoS house price statistics: No.
Seasonal adjustment
House Price Index: A separate seasonally adjusted series is available, calculated at the regional and national level only.
RoS house price statistics: No.
Revisions
House Price Index: Thirteen-month cycle – final figures at thirteen-month update.
RoS house price statistics: time series are revised monthly, quarterly and annually as appropriate for the series. Users should use the complete time series in the latest available statistics.
Volume of sales
House Price Index: Yes.
RoS house price statistics: Yes.
Property types
House Price Index: Yes – detached, semi-detached, terrace, flat.
RoS house price statistics: Yes – detached, semi-detached, terrace, flat.
Cash sales
House Price Index: Yes
RoS house price statistics: Yes, identified separately in calendar year tables and property market report.
New builds
House Price Index: Yes
RoS house price statistics: Yes, identified separately in calendar year tables and property market report.
Buyer analysis
House Price Index: Yes – statistics relating to first-time buyers and former owner-occupiers is extracted from CML data.
RoS house price statistics: No - first-time buyers and former owner-occupiers are included but not separately identified.
Results
House Price Index: Average prices presented as geometric means are typically closer to the median than the arithmetic mean
RoS house price statistics: Typically the arithmetic mean will lead to a higher price than other measures. Due to the distribution of residential property prices, the arithmetic mean can be influenced by the sale of a few high value properties. Median prices are included as an alternative and the results are usually closer to the geometric mean.
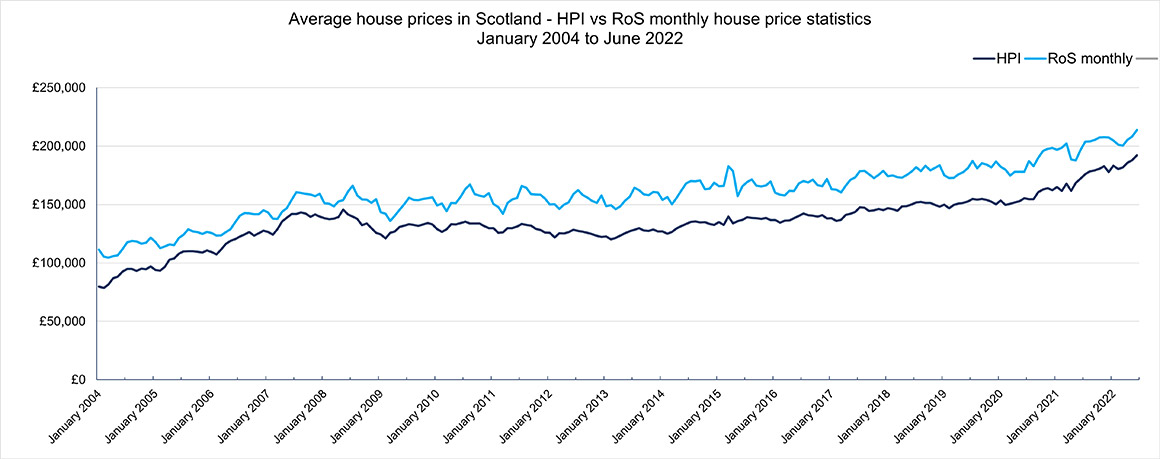
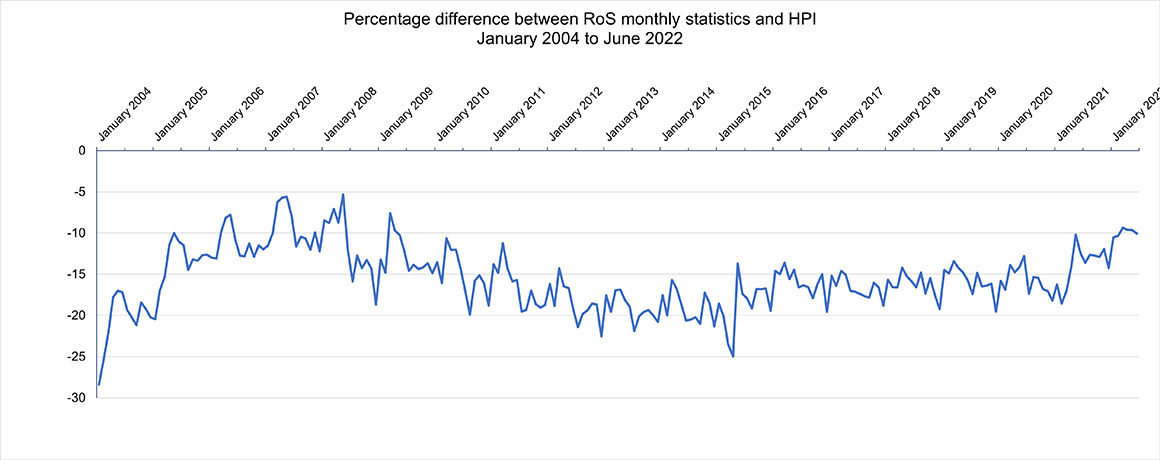
Average prices

(Click image to enlarge)
(Click image to enlarge)
(Click image to enlarge)
The average price trends when comparing the HPI with RoS house price statistics are very similar. RoS data is based on the date of registration, while the HPI is based on the date of entry. Registration can occur up to several weeks after the date of entry. In 2022 the date of registration was on average 19 days after the date of entry.
Quarterly and monthly averages based on arithmetic means are higher in the RoS statistics than in the HPI. This is expected because of the different methodologies used - specifically, the use of an arithmetic mean within the RoS statistics, versus a geometric mean in the HPI. The geometric mean will typically be closer to the median than the arithmetic mean.
The HPI monthly figures are smoother than the RoS monthly house price statistics, again because of the different methodologies used. The HPI figures are mix adjusted, while the RoS house price statistics are unadjusted, which means the RoS figures are more prone to fluctuations in the market, for example if a high number of high or low-value sales are registered within a particular month.
On average, over the last 3 years, the HPI house price averages are:
- 12.8% lower than RoS monthly arithmetic means (ranging from -10.4% to -17.1%)
- 2.3% higher than RoS monthly medians (ranging from -4.2% to +5.7%).
Volumes
There are slight differences in the volumes being presented because the RoS data is based on date of registration, while the HPI is based on date of entry. RoS volumes, used for arithmetic means, excludes any sales below £20,000 and above £1,000,000. The HPI methodology does not apply price limits, but excludes outliers.