
Why the median is the preferred measure in Registers of Scotland’s house price statistics.
When reporting house prices, the choice of average matters. Three methods used are:
- the arithmetic mean (the sum of all house prices divided by the number of properties)
- the median (the price at the midpoint of the distribution, with half of properties priced above and half below)
- the geometric mean (a third, less common, measure which is used in the UK House Price Index)
This article will focus on the two most common measures – the arithmetic mean and the median.
Typically, the arithmetic mean produces a higher figure than the median for residential property prices. This is because property prices are not evenly distributed: while most properties are sold within a relatively narrow range, a small number of very high-value sales can significantly increase the mean.
The median is less affected by these extreme values and therefore provides a better indication of the price paid for a "typical" property. For this reason, Registers of Scotland (RoS) uses the median as the primary measure in its house price statistics.
How the mean and median differ
The chart below shows the distribution of residential property sales during financial year 2025-26. The sales are grouped into £10,000 price bands to make the chart easier to read.
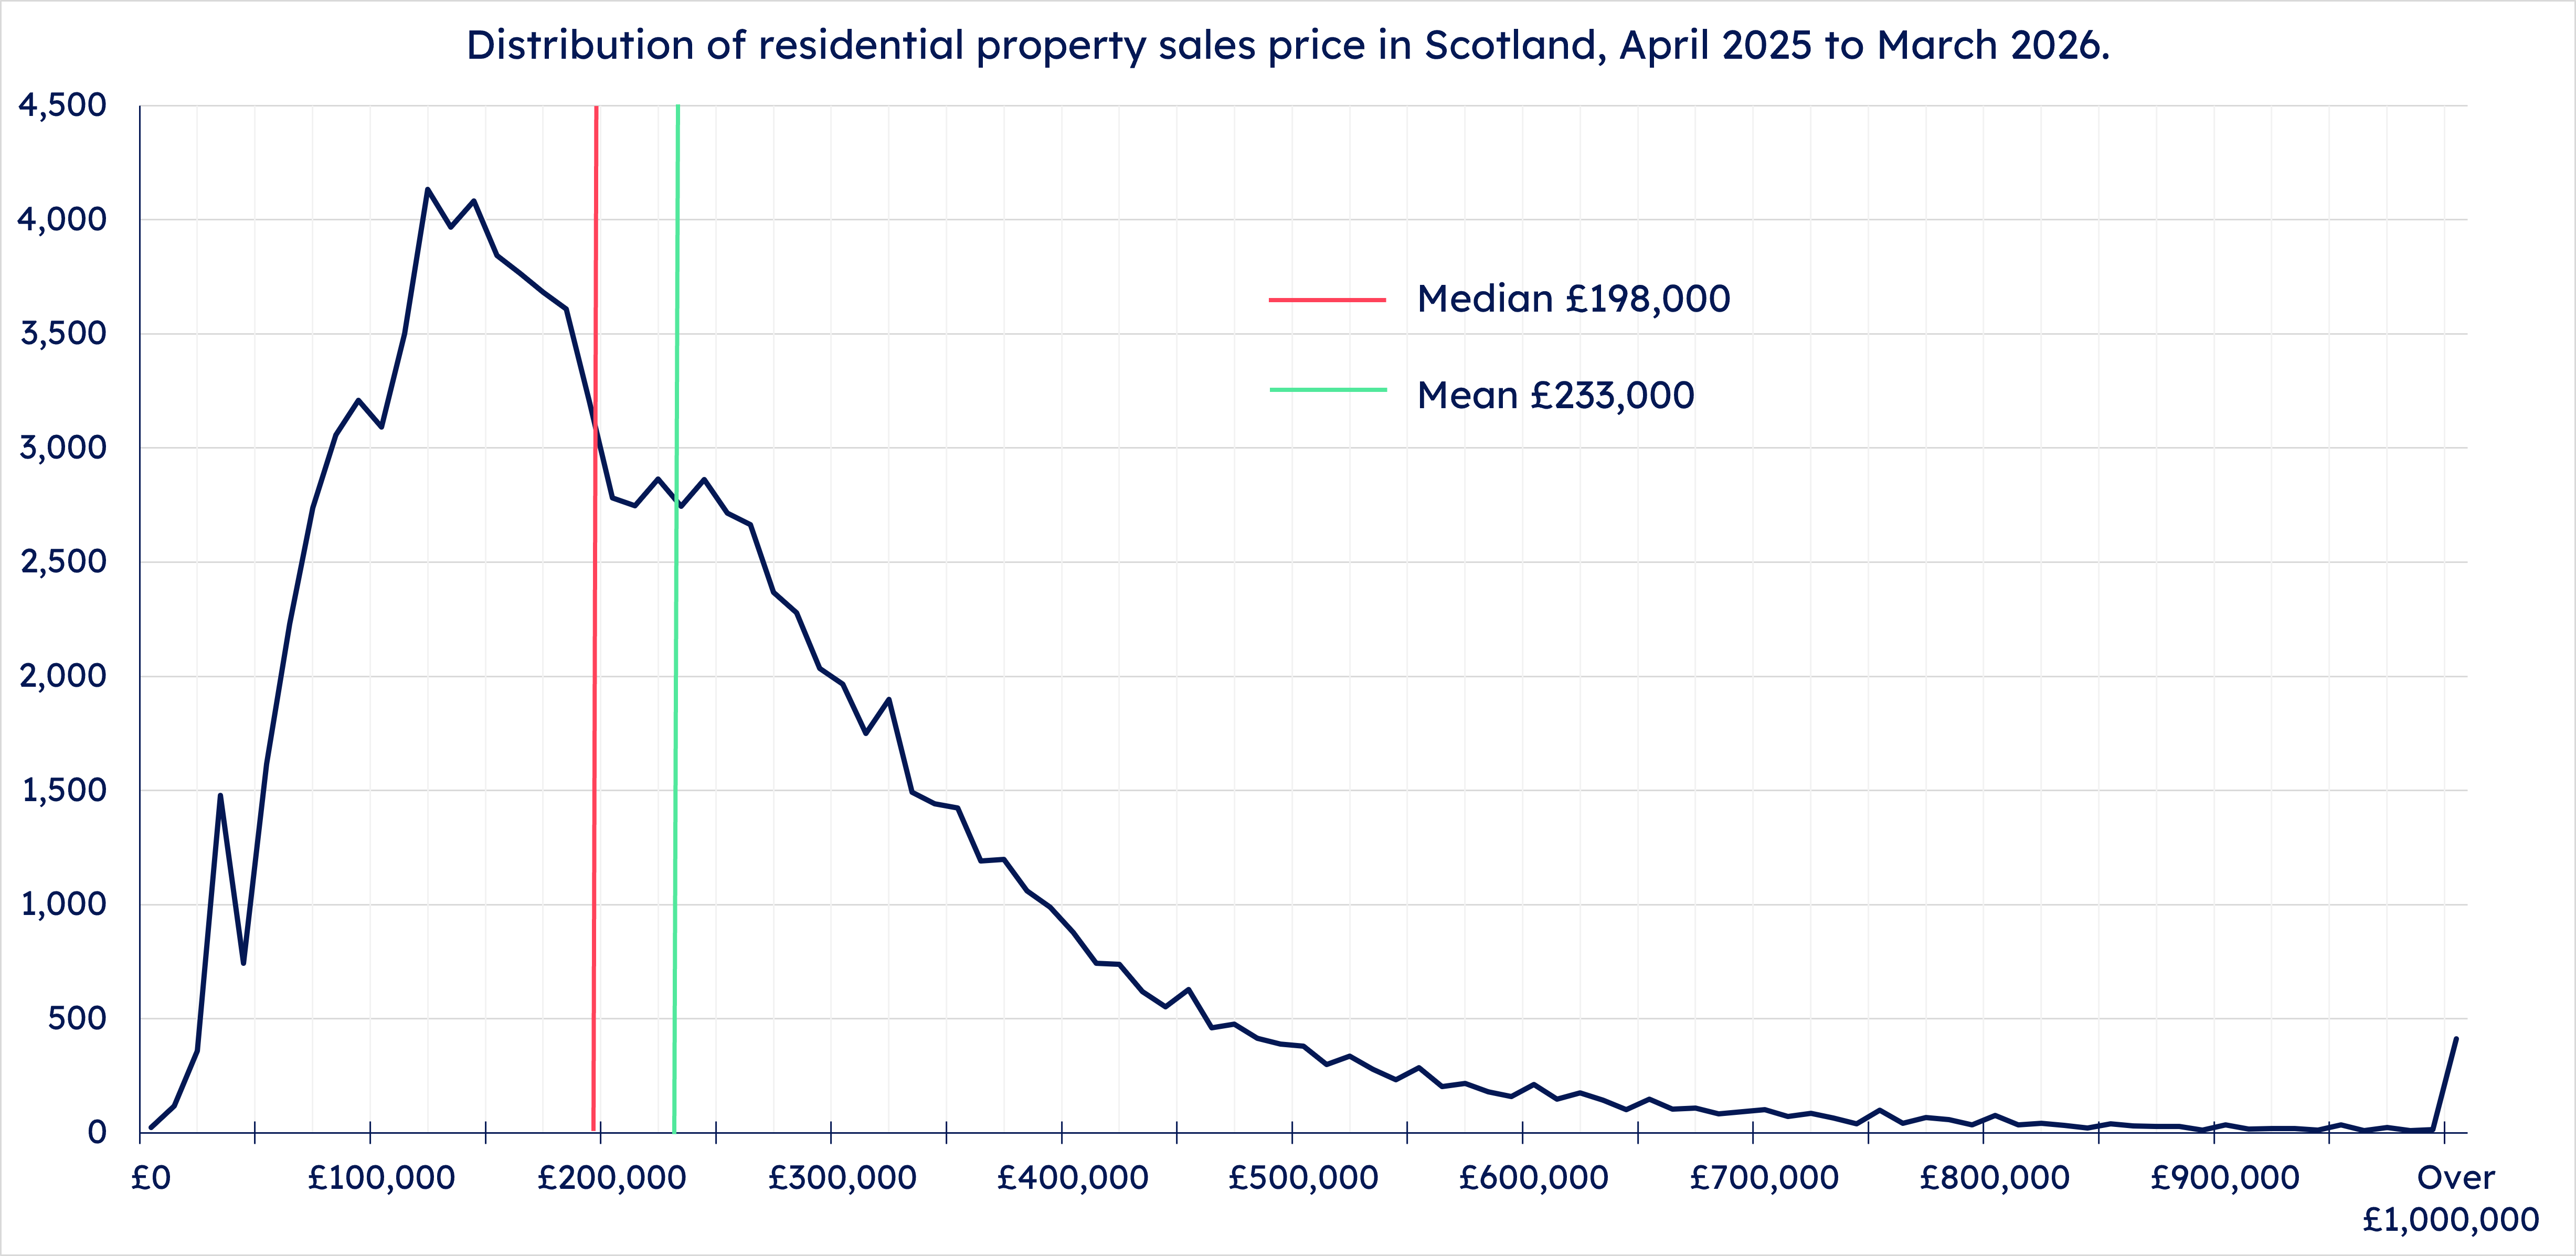
Please note, the spike at ‘Over £1,000,000’ is caused by grouping all properties over this value.
The chart shows that, in 2025-26:
- Median property price was £198,000
- Mean property price was £233,000
Most property sales occurred between £128,000 and £298,000. However, the housing market also included a smaller number of very high-value properties. Although these sales represent a small proportion of transactions, they have a large influence on the mean, pulling it upwards.
The median is unaffected by how high these individual sales are. It simply identifies the middle sale when all transactions are ordered by price. As a result, it provides a more stable and representative measure of typical house prices.
Limitations of the median
While the median is the preferred measure for describing property prices, it does have some limitations which are important to note.
Unlike means, medians cannot be combined or weighted together to create an overall figure. For example:
- If one area has a median house price of £180,000 and another has a median of £220,000, it is not possible to calculate the national median by averaging those two figures.
- The national median must be calculated directly from all individual property transactions.
This means that medians should be interpreted carefully when combining different geographies or attempting to aggregate statistics across different groups.
As with all summary statistics, caution should be taken when there are a low number of sales. This is because when there are few sales, an individual sale can have a greater impact on the results.
Lower and upper quartiles
Moving to a median-based approach also gives the opportunity to publish a broader range of distributional statistics. Measures such as the lower quartile, median and upper quartile provide information about different parts of the market, helping users understand not just what a typical property costs, but how prices vary across the full distribution of sales.
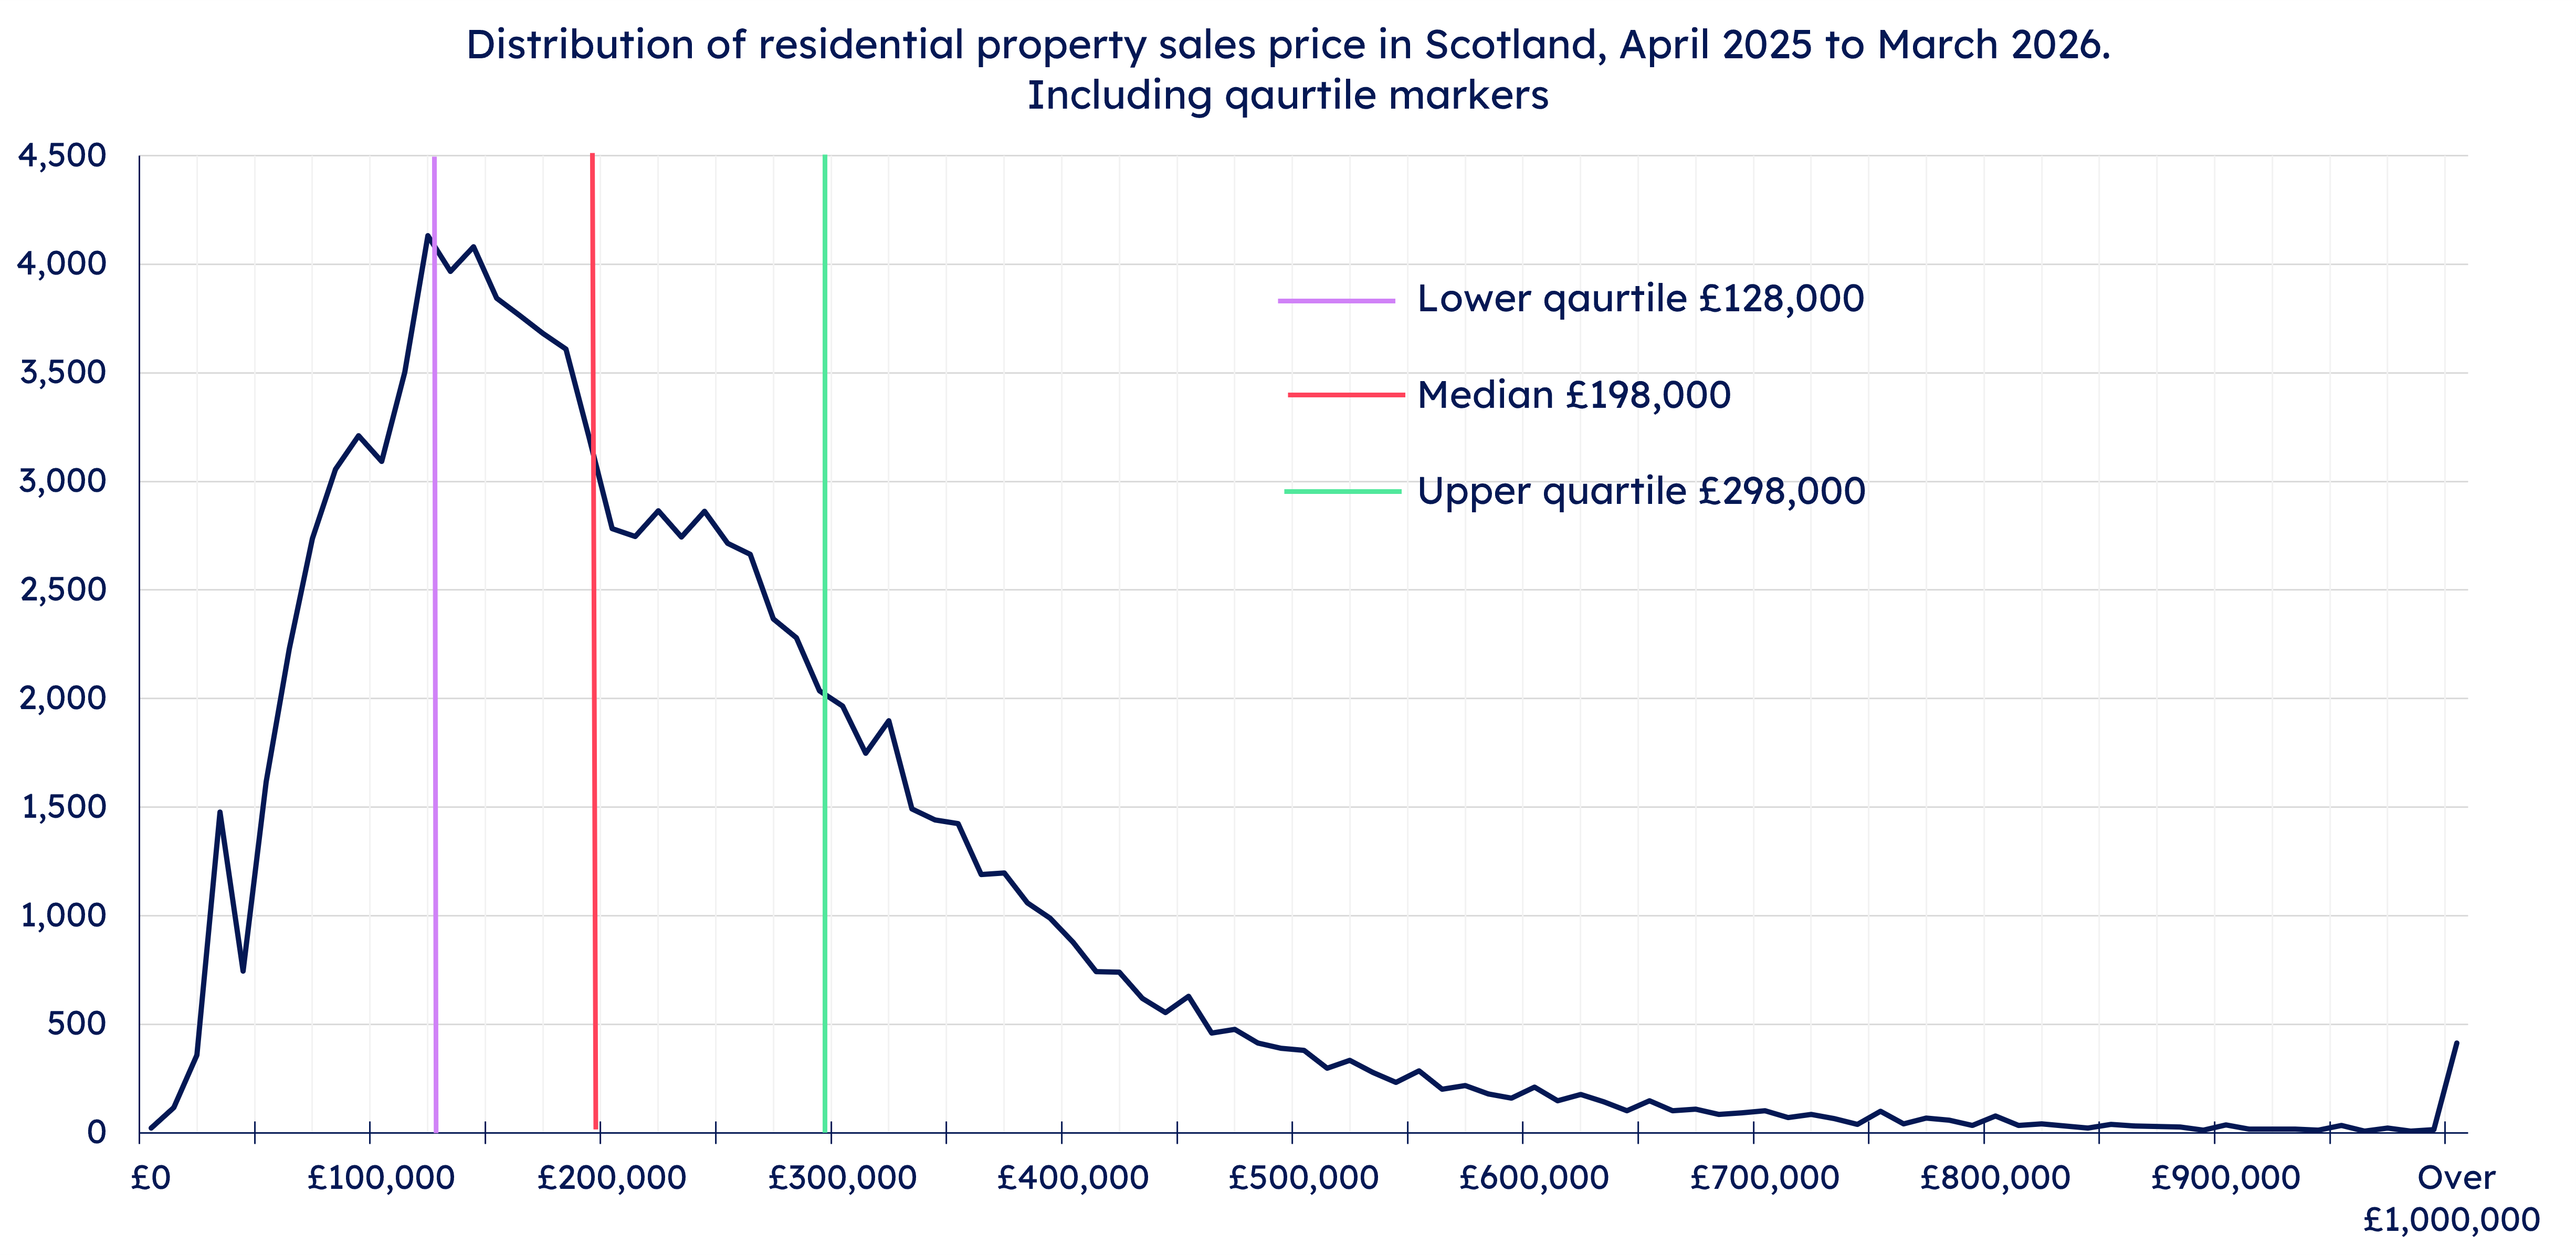
The lower quartile is the median of the lower half of the data. This means that a quarter of sales were for a price which was less than the lower quartile value.
The upper quartile is the median of the upper half of the data. This means that a quarter of sales that a quarter of sales were for a higher price than the upper quartile value (or three-quarters were below this value).
For example, in the chart below, of the total number of sales:
- 25% were below £128,000 (lower quartile)
- 50% were below £198,000 (median)
- 75% were below £298,000 (upper quartile)
This approach aligns with the wider aim of providing statistics that are representative, robust and less influenced by a relatively small number of exceptionally high-value transactions.
Next steps
Given the advantages of the median as a measure of the typical house price, in 2023/24 we changed the analysis in our annual Property Market Report to still include medians but no longer show means. Going forward, we will be aligning our monthly house price statistics publication to this approach.
By focusing on the median, RoS aims to provide a measure that is less influenced by exceptionally high or low-value sales and more representative of the experience of most buyers and sellers in the Scottish housing market.
Feedback
We welcome feedback on all our statistics. If you have any feedback, or questions about anything mentioned in this blog, then please email the RoS Statistics team at statistics@ros.gov.uk.