Three key figures for February
- £150,524
The average price of a property in Scotland - 2.5%
The annual price change of a property in Scotland - -1.6%
The monthly price change of a property in Scotland
Estimates for the most recent months are provisional and are likely to be updated as more data is included.
The latest provisional statistics from the UK House Price Index (HPI) show that the average price of a property in Scotland in February 2020 was £150,524 – an increase of 2.5 per cent on February 2019.
The statistics presented here are for residential property sales with a February 2020 completion date. For the majority of these sales, the process for completion would have started several weeks earlier and unlikely to be affected by coronavirus.
Comparing with the previous month, house prices in Scotland decreased by 1.6 per cent between January 2020 and February 2020.
The UK average house price was £230,332 which was an increase of 1.1 per cent on February 2019 and a decrease of 0.6 per cent on the previous month.
The volume of residential sales in Scotland in December 2019 was 7,984, an increase of 8.0 per cent on the original provisional estimate for December 2018. This compares with a decrease of 0.4 per cent in England, 3.1 per cent in Wales, and an increase of 5.0 per cent in Northern Ireland (Quarter 4 – 2019 compared with quarter in previous year).
In Scotland, terraced houses showed the largest increase, rising by 3.3% in the year to February 2020 to £125,491. Detached houses showed the smallest increase, rising by 1.9% to £258,401.
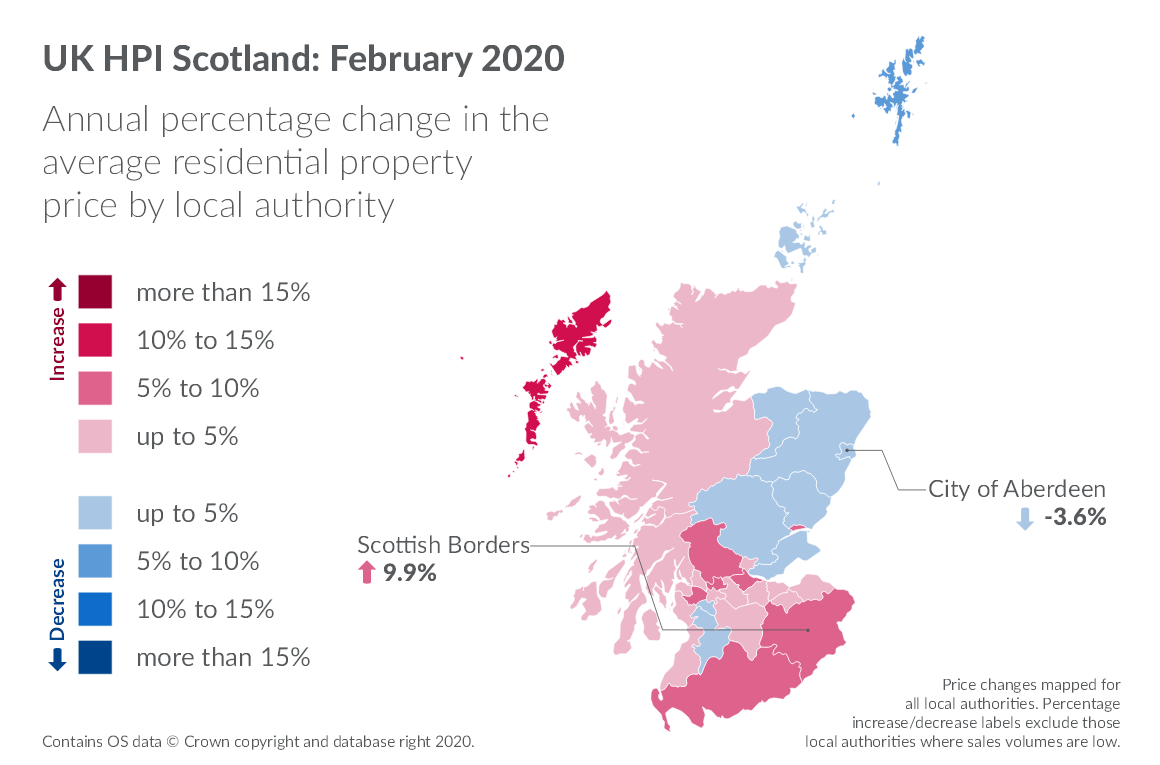
Average price increases were recorded in the majority (22) of local authorities, when comparing prices with the previous year. The largest increase was in Scottish Borders, where the average price increased by 9.9 per cent to £160,411.
The largest decrease was recorded in City of Aberdeen, where the average price fell by 3.6 per cent to £143,990. Local authority estimates are based on a three-month moving average to reduce volatility.
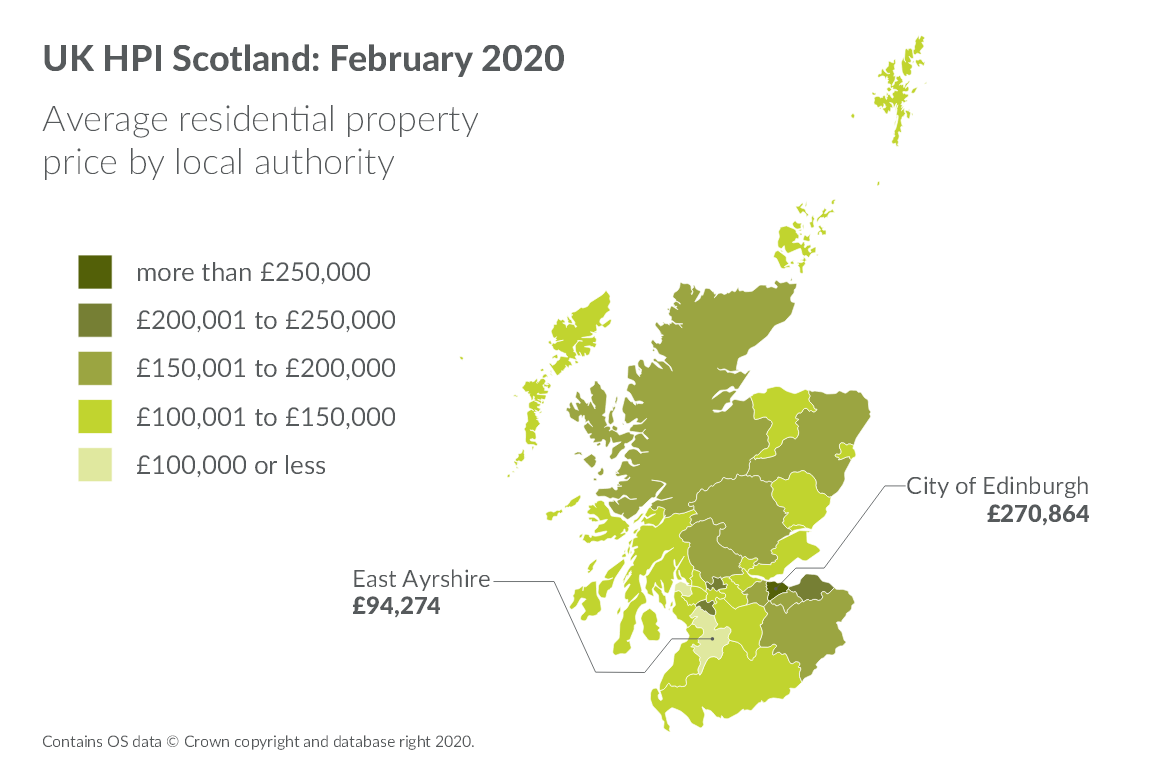
In February 2020, the highest-priced area to purchase a property was City of Edinburgh, where the average price was £270,864. In contrast, the lowest-priced area to purchase a property was East Ayrshire, where the average price was £94,274.
Further information on HPI Scotland by local authority, property type, first time buyers and cash sales can be found in the latest HPI Scotland publication.
As with other indicators in the housing market, which typically fluctuate from month-to-month, it is important not to put too much weight on one month’s set of house price data.
Notes to editors
- The UK HPI is published on the second or third Wednesday of each month with Northern Ireland figures updated quarterly. See the calendar of release dates.
- RoS are working with its UK HPI partners to ensure that the UK HPI continues to be published during the coronavirus outbreak. Future UK HPI publications will depend on the amount of data available, able to be collected and processed not just in Scotland but across the UK. March 2020 data is due to published on 20 May 2020.
- The statistics have been produced in accordance with the Code of Practice for Statistics. The UK House Price Index is calculated by the Office for National Statistics and Land & Property Services Northern Ireland. The UK HPI was designated as National Statistics by the Office for Statistics Regulation on 18 December 2018.
- Registers of Scotland provides data on residential property sales for the Scotland element of the UK House Price Index. Separate HPI releases are also published by HM Land Registry and Land & Property Services Northern Ireland, which focus on the figures for England and Wales and for Northern Ireland. The Office for National Statistics also publishes a monthly HPI statistical bulletin with commentary on the whole of the UK.
- Details of all of our property statistics releases and future publication dates are available on our website. A comparison guide comparing the different house price index measures that are published in the UK is also available.
- Information on individual property purchase prices is available for free via our ScotLIS service.
- Sign up for our data stats alert service.