Key figures for April 2026:
- £192,000
The average price of a property in Scotland - 2.8%
The annual price change of a property in Scotland - 2.7%
The monthly price change of a property in Scotland - 109.6
The index figure for Scotland (January 2023 = 100)
The House Price Index for April 2026 reflects applications received up to the end of April 2026. Estimates for the most recent months are provisional and are likely to be updated as more data is included.
The latest HPI for Scotland shows the average price of a property in Scotland in April 2026 was £192,000, an increase of 2.8% when compared to April 2025.
Compared to the previous month, house prices in Scotland increased by 2.7% on a non-seasonally adjusted basis, whilst on a seasonally adjusted basis there was an increase of 1.0%.
The UK average house price was £270,000 which was an annual increase of 3.8% on April 2025. Compared with the previous month, UK house prices increased by 0.7% on a non-seasonally adjusted basis and increased by 0.6% on a seasonally adjusted basis.
The volume of residential sales in Scotland in February 2026 was 6,190. When compared with the first published figures for February 2025 this was an annual increase of 1.5%. Published transactions for recent months will increase as later registered transactions are incorporated into the index.
Commenting on the house price figures in Scotland, a Registers of Scotland spokesperson said:
“There was an increase of 2.8% (to £192,000) in the average house price for Scotland in the 12 months to April 2026. This compares to an increase of 3.8% (to £270,000) in average house prices for the UK as a whole.”
The table below provides Scotland house prices and annual changes by property type.
| Property type | House price level (£) | Annual house price percentage change |
|---|---|---|
| Detached | £351,000 | 2.8% |
| Semi-detached | £218,000 | 3.4% |
| Terraced | £178,000 | 4.7% |
| Flats or Maisonettes | £136,000 | 1.5% |
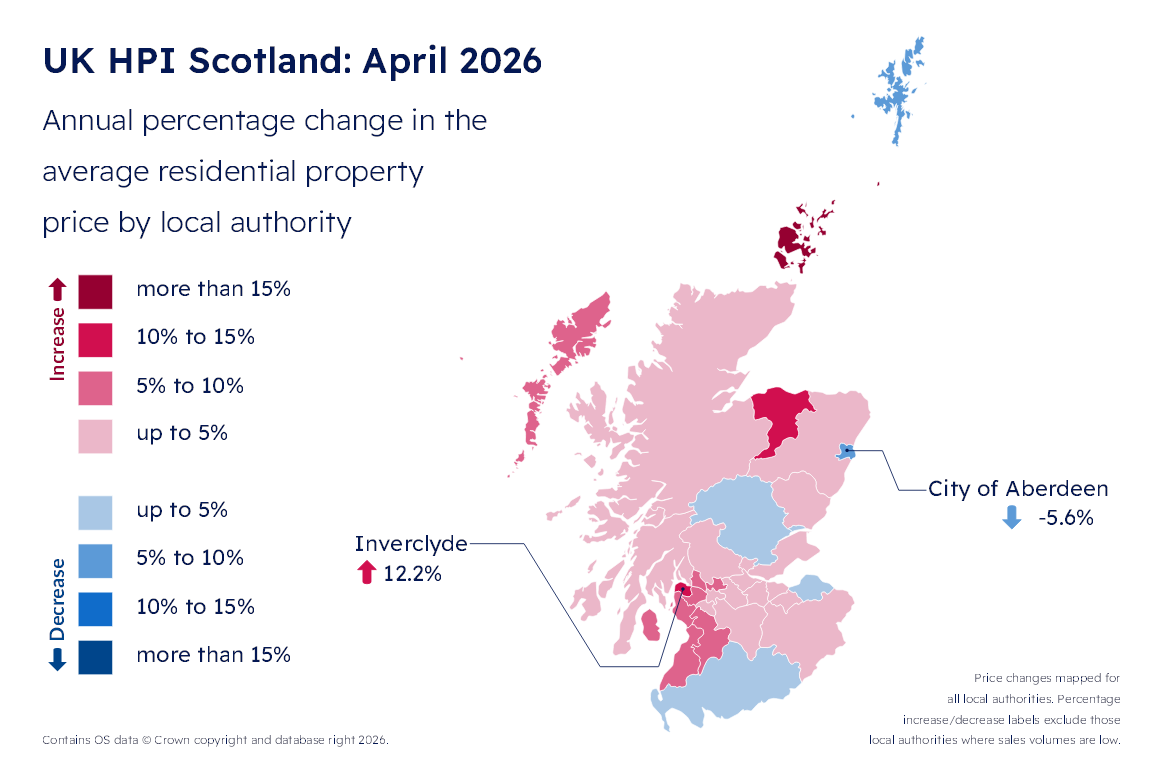
Average prices for Local Authorities are based on a 3-month moving average to help remove some of the volatility in the series. Increases were recorded in 26 out of 32 local authority areas, when comparing prices with the previous year. The largest increase was in Inverclyde where the average price increased by 12.2% to £116,000. The largest decrease was recorded in City of Aberdeen, where the average price decreased by 5.6% to £130,000. Orkney Islands, Na h-Eileanan Siar and Shetland Islands are not considered when highlighting which local authorities have experienced the highest/lowest increase, due to the very low numbers of sales transactions in these local authorities which can lead to volatility in the series.
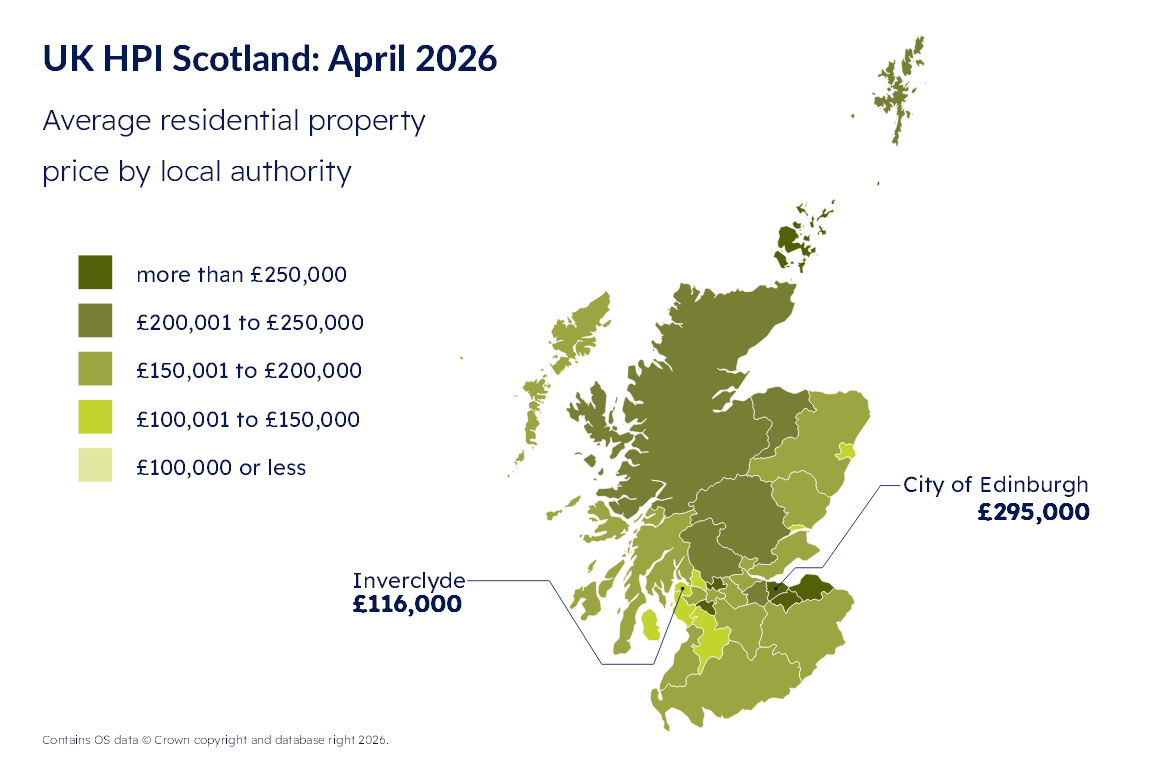
In April 2026, the highest-priced area to purchase a property was City of Edinburgh, where the average price was £295,000. In contrast, the lowest-priced area to purchase a property was Inverclyde, where the average price was £116,000.
Further information on HPI Scotland by local authority, property type, first time buyers and cash sales can be found in the latest latest HPI for Scotland. Visualisations can be found the ONS Housing prices in your area page.
As with other indicators in the housing market, which typically fluctuate from month-to-month, it is important not to put too much weight on one month’s set of house price data.
Notes to editors
- Registers of Scotland is the public body responsible for compiling and maintaining registers relating to property and other legal documents in Scotland. Registers of Scotland records and safeguards the rights of the individual while providing open access to information on the registers. Information on individual property purchase prices is available for free via our ScotLIS service.
- On 20 August 2025, the Office for National Statistics introduced an improvement to the UK HPI methodology for Great Britain. This change reduces the initial over‑estimation of new build prices. Users should note that new build prices remain subject to greater uncertainty, and revisions to provisional estimates may continue to be larger than for other property types. Further details are available in section 4.9 of HM Land Registry’s About the UK House Price Index document.
- These statistics have been produced in accordance with the Code of Practice for Statistics. The UK House Price Index is a joint publication between Registers of Scotland, HM Land Registry (England and Wales), Land & Property Services Northern Ireland, and the Office for National Statistics. The UK HPI was designated as National Statistics by the Office for Statistics Regulation on 18 October 2018.
- Economic commentary is available along with separate HPI releases for the UK, England and Wales and for Northern Ireland.
- More information is available in the UK HPI Quality and Methodology Information. A calendar of release dates is available.
- A comparison guide comparing the HPI with other RoS property statistics is available.
- Sign up for our data stats alert service.