This report provides statistics on the property market in Scotland from 2003-04 to 2025-26.
Table of contents
Introduction
Below are the main findings of the Property Market Report 2025-26, providing a long-term review of trends in market value residential and non-residential property sales from 2003-04 to 2025-26.
View the latest Property Market Report in full.
View the associated data tables.
More charts and visualisations of the data are also available via our Tableau dashboard.
Previous reports can be viewed via our publications page.
Residential market
Overview
Figure 01: Residential market summary, 2025-26 data tables 1-3
| Scotland | 2025-26 | 1 year % change | 3 year % change | 10 year % change |
|---|---|---|---|---|
| Volume of sales | 104,408 | 5% | 3% | 4% |
| Median price | £198,000 | 4% | 7% | 41% |
| Market value | £24.3 billion | 7% | 8% | 45% |
The volume of sales increased by 5% between 2024-25 and 2025-26 and the median price of a residential property increased by 4%, from £190,000 to £198,000, during the same period.
The total market value of residential sales was £24.3 billion in 2025-26. Over the time series from 2003-04, 2025-26 had the largest market value, surpassing the previous peak of £23.2 billion in 2007-08 (not adjusting for inflation).
Figure 02: Residential sales by volume and median price from 2003-04 to 2025-26, data tables 1 & 2
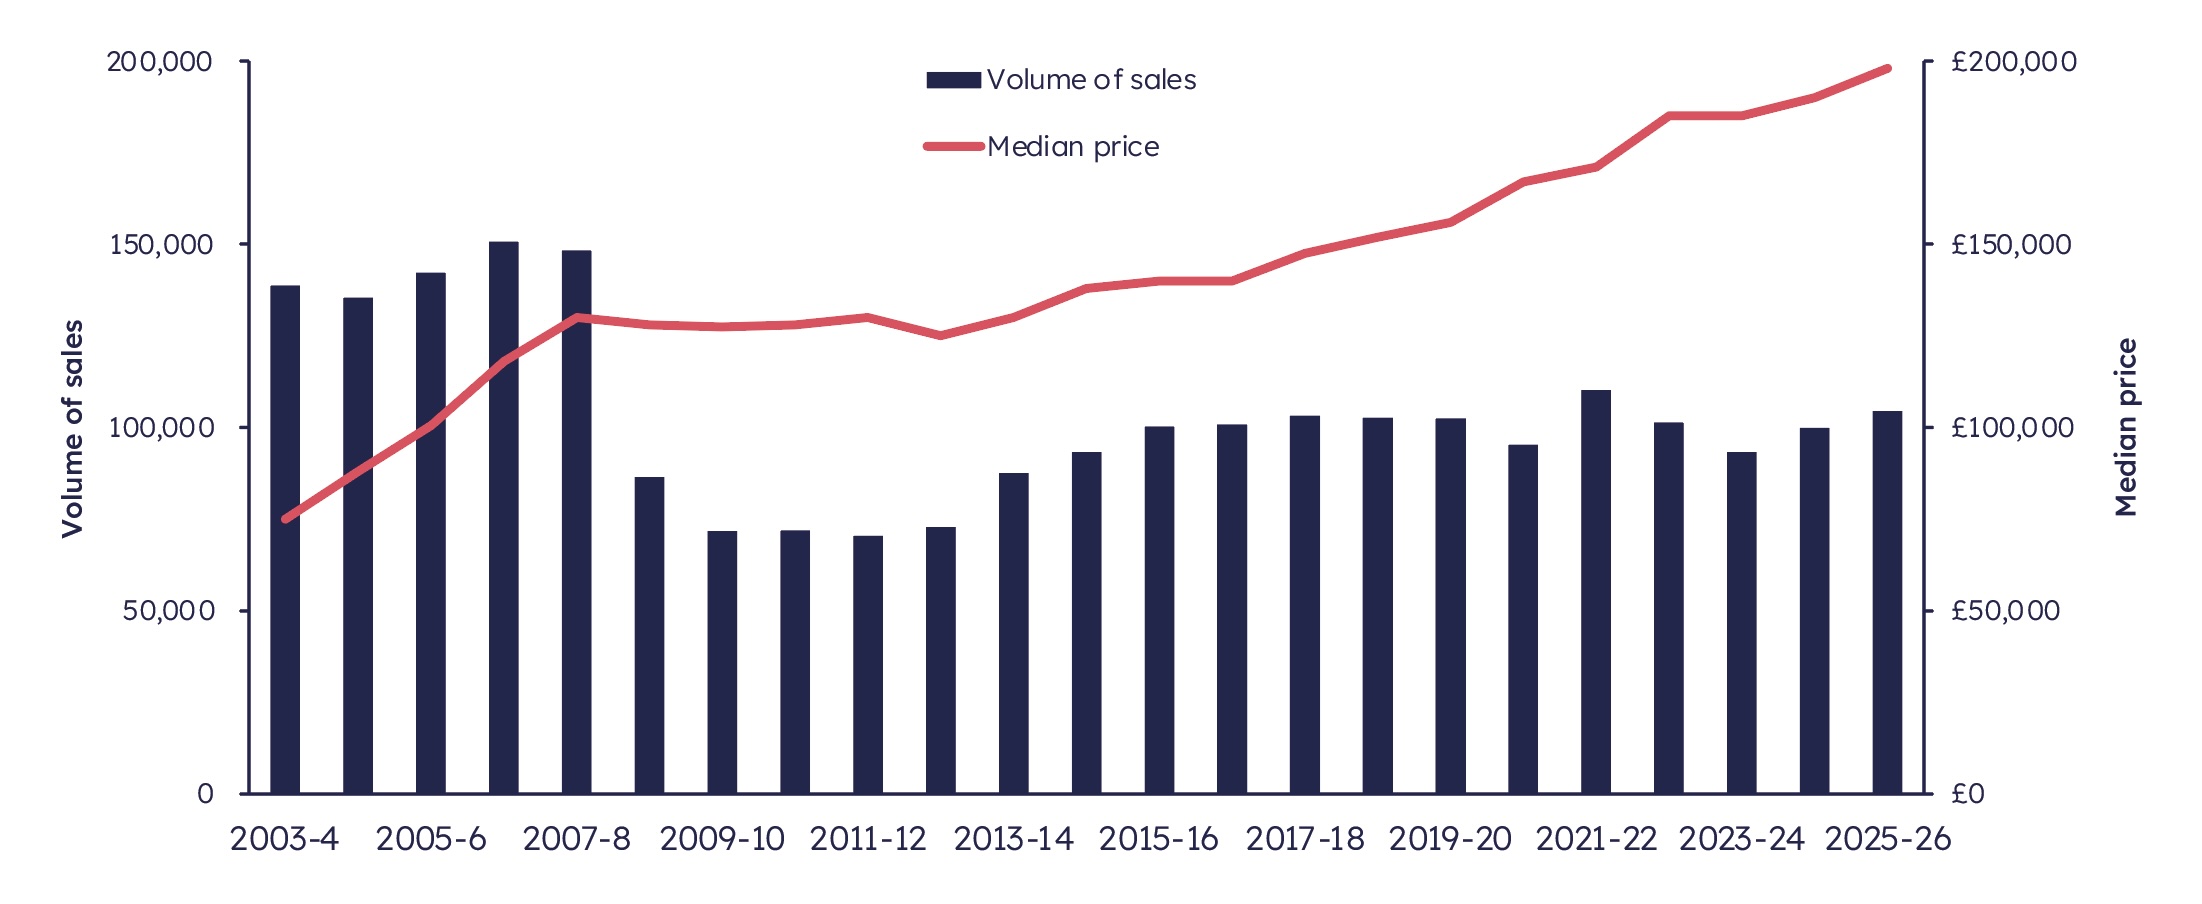
Figure 03: Volume of residential sales in Scotland by price band, 2025-26 data table 8.
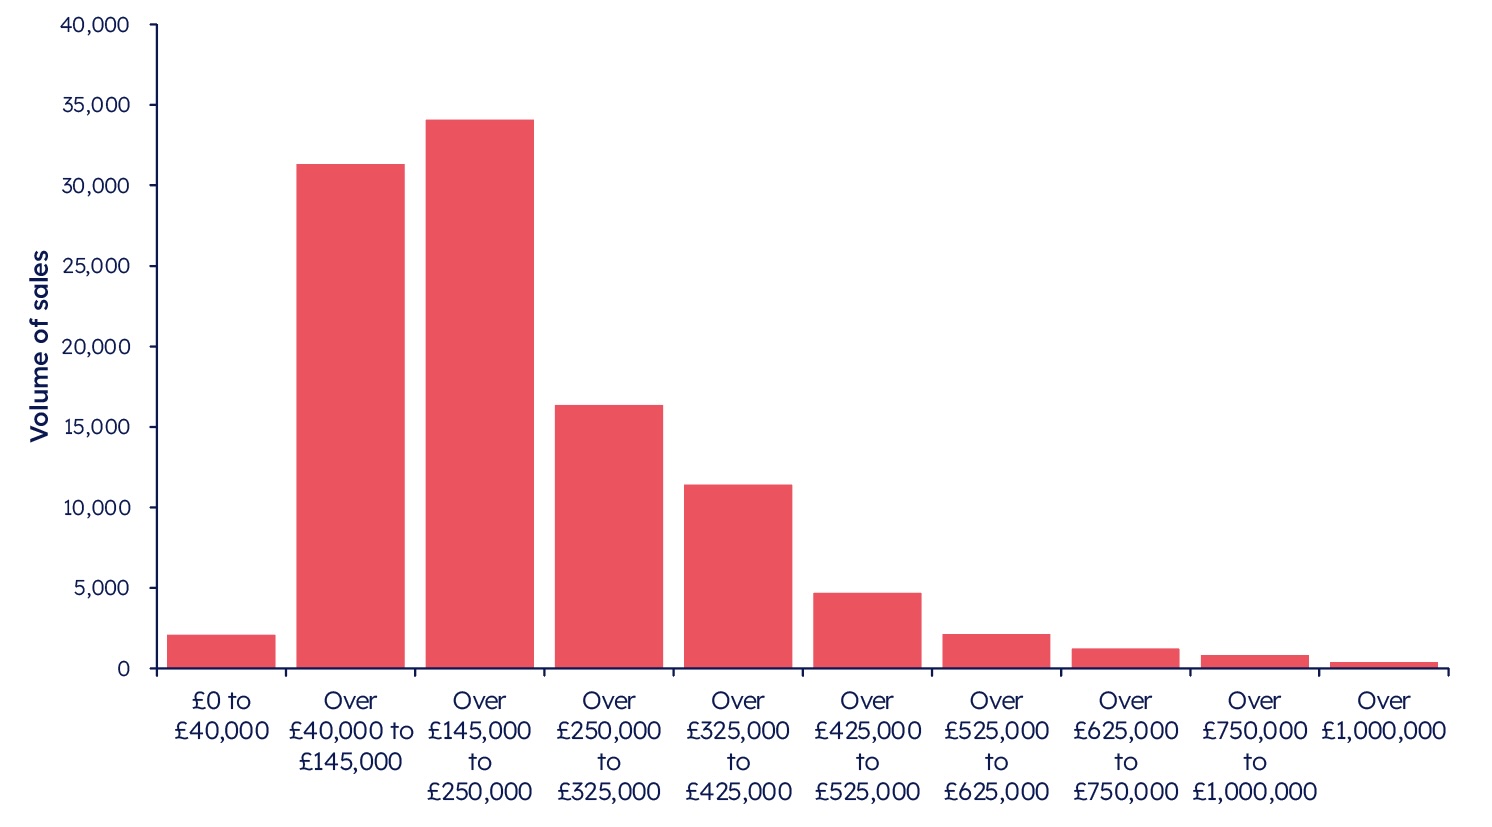
In 2025-26:
- Around two thirds of residential property sales in Scotland were £250,000 or less
- 31% of sales were over £250,000 and up to £525,000
- 4% of sales were over £525,000
More information on this section is available in chapter 1.1 of the full report.
House types
Figure 04: House type summary, 2025-26, data tables 12-14
| Detached | Semi-detached | Terraced | Flat | |
|---|---|---|---|---|
| Volume of sales | 21,815 | 17,274 | 20,701 | 38,440 |
| Market value (million) | £7,740 | £3,962 | £4,050 | £6,597 |
| Median price | £324,995 | £210,000 | £160,000 | £138,017 |
Figure 05: Median residential price by house type, 2003-04 to 2025-26, data table 22.
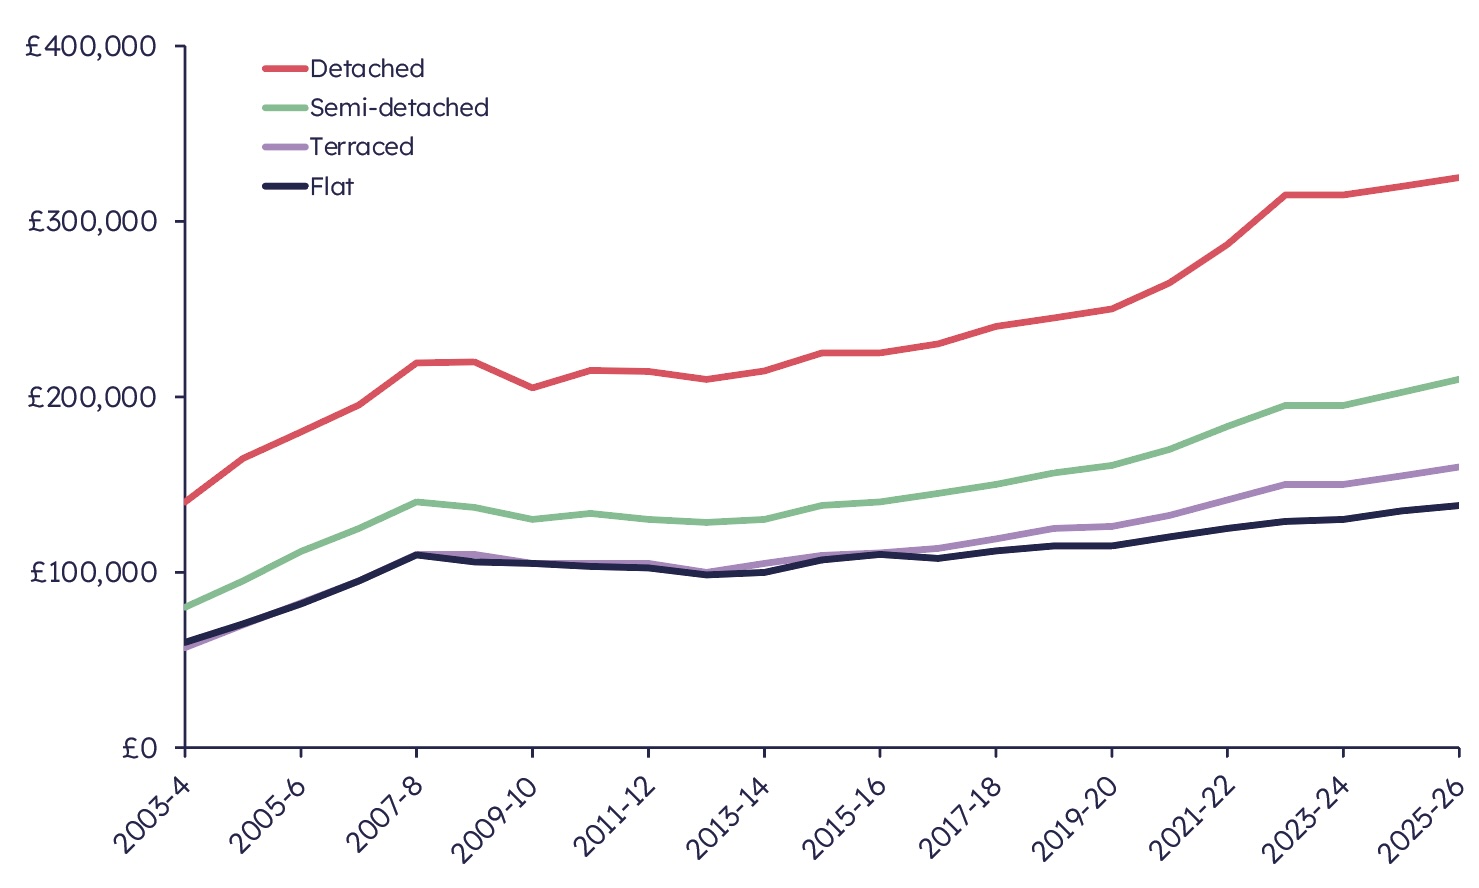
Flats had the highest volume of sales in 2025-26, accounting for around 37% of all properties sold. Over the last ten years, the proportion of properties sold of each house type has not seen much change, however flats have shown the slowest growth in prices at 25%, compared to 44-50% for other house types.
More information on this section is available in chapter 1.2 of the full report.
New Builds
Figure 06: New build summary, 2025-26, data tables 16-18
| New builds | 2025-26 | % of all residential sales | 1 year % change | 3 year % change | 10 year % change |
|---|---|---|---|---|---|
| Volume of sales | 10,290 | 10% | 8% | -20% | -6% |
| Median price | £317,995 | - | 3% | 11% | 51% |
| Market value | £3.5 | 14% | 9% | -13% | 33% |
The number of new build sales increased in 2025-26 following a two-year decline. In 2025-26, new builds accounted for around 10% of all residential sales, whilst they accounted for around 14% of the market value of all residential sales.
Figure 07: Comparison of median price of new build residential sales and existing dwelling residential sales by house type, 2025-26, data table 24
| Detached | Semi-detached | Terraced | Flat | All house types | |
|---|---|---|---|---|---|
| New build median | £369,000 | £259,995 | £254,995 | £269,998 | £317,995 |
| Existing dwelling median | £315,000 | £203,125 | £157,000 | £135,550 | £183,630 |
| % difference | 17% | 28% | 62% | 99% | 73% |
The median price for new build sales was higher than for existing dwellings, with a median price of £317,995 for new builds compared to £183,630 for existing dwelling sales in 2025-26.
Median new build prices were higher across all property types. The proportion of sales of each house type contributes to the scale of the overall difference in price:
- Detached properties made up 32% of new build sales but only 20% of sales of existing dwellings - detached properties tend to be more expensive than flats
- Flats made up 40% of sales of existing dwellings but only 8% of new build sales - flats tend to be less expensive than other property types
More information on this section is available in chapter 1.3 of the full report.
Mortgage and cash sales
Figure 08: Volume of residential sales by funding status, and percentage of total sales funded with a mortgage, 2003-04 to 2025-26, data table 29
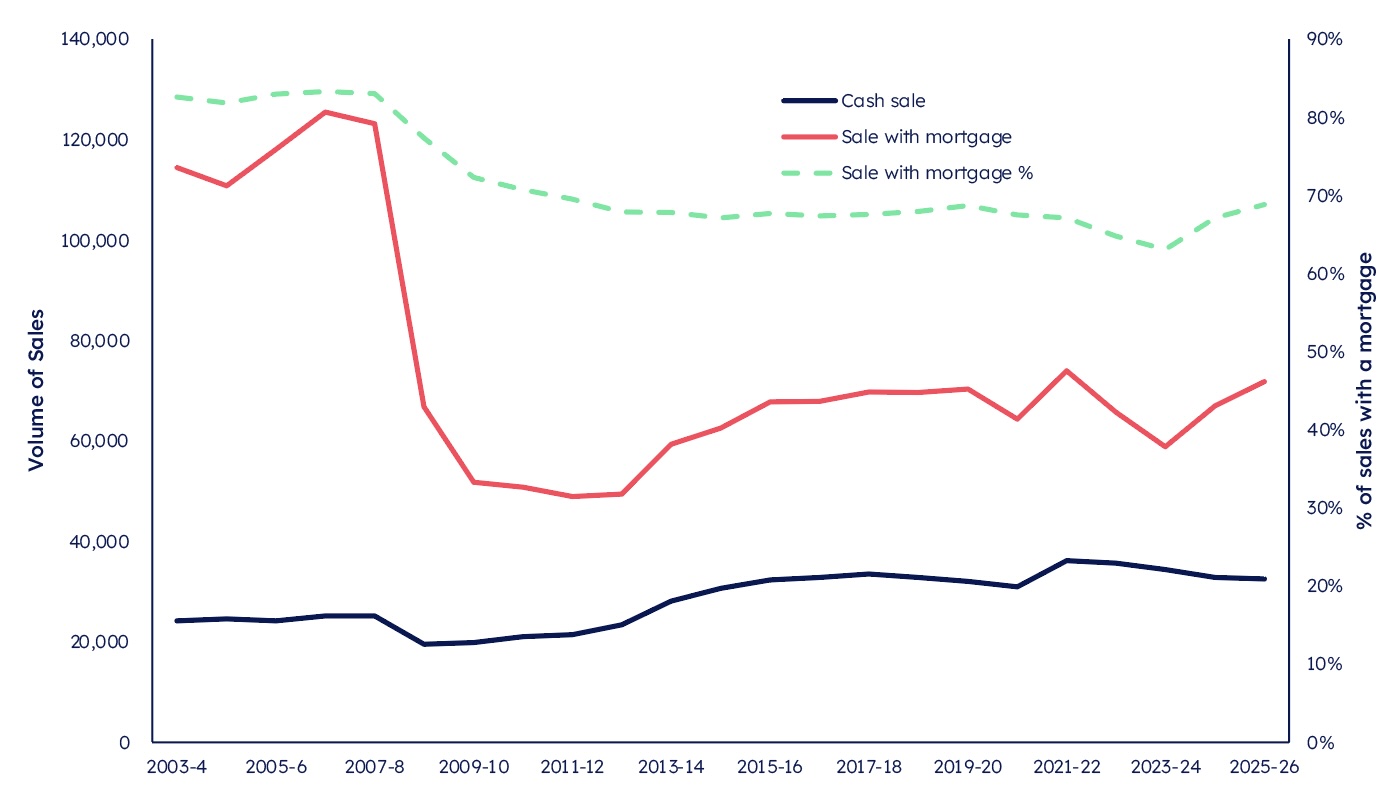
In 2025-26:
- 69% of residential sales were with a mortgage, with 31% of sales being cash sales (71,874 sales with a mortgage and 32,534 cash sales)
- the volume of property related mortgage securities submitted for registration, which includes mortgage sales and remortgage/additional borrowing, was 116,840, an increase of 8% when compared with 2024-25
More information on this section is available in chapter 1.4 of the full report.
Local Authorities
Glasgow City and City of Edinburgh local authority areas had the largest number of sales in 2025-26 with 11,305 and 11,169 sales respectively. This accounted for 22% of all residential sales in Scotland.
In 2025-26 the local authority with the highest median house sale price was East Renfrewshire at £305,200 and Inverclyde had the lowest median house price at £123,000.
Over the last 3 years from 2022-23 to 2025-26, most local authorities had an increase in median house price. Aberdeen City, Aberdeenshire and the Orkney Islands were the only local authorities to have a decrease in median price.
In 2025-26, there were 392 residential sales priced over £1 million across Scotland, similar to 2024-25. Over half of all sales priced over £1 million were in the City of Edinburgh.
More information on this section is available in chapter 1.5 of the full report.
Cities
Scotland’s eight cities are defined using locality information from National Records of Scotland. A city is not the same as a local authority, even if it has the same, or a similar, name. For example, the city area of Aberdeen is different to the local authority of Aberdeen City.
Figure 09: Percentage of volume and value of sales by city, 2025-26, data tables 37 & 39.
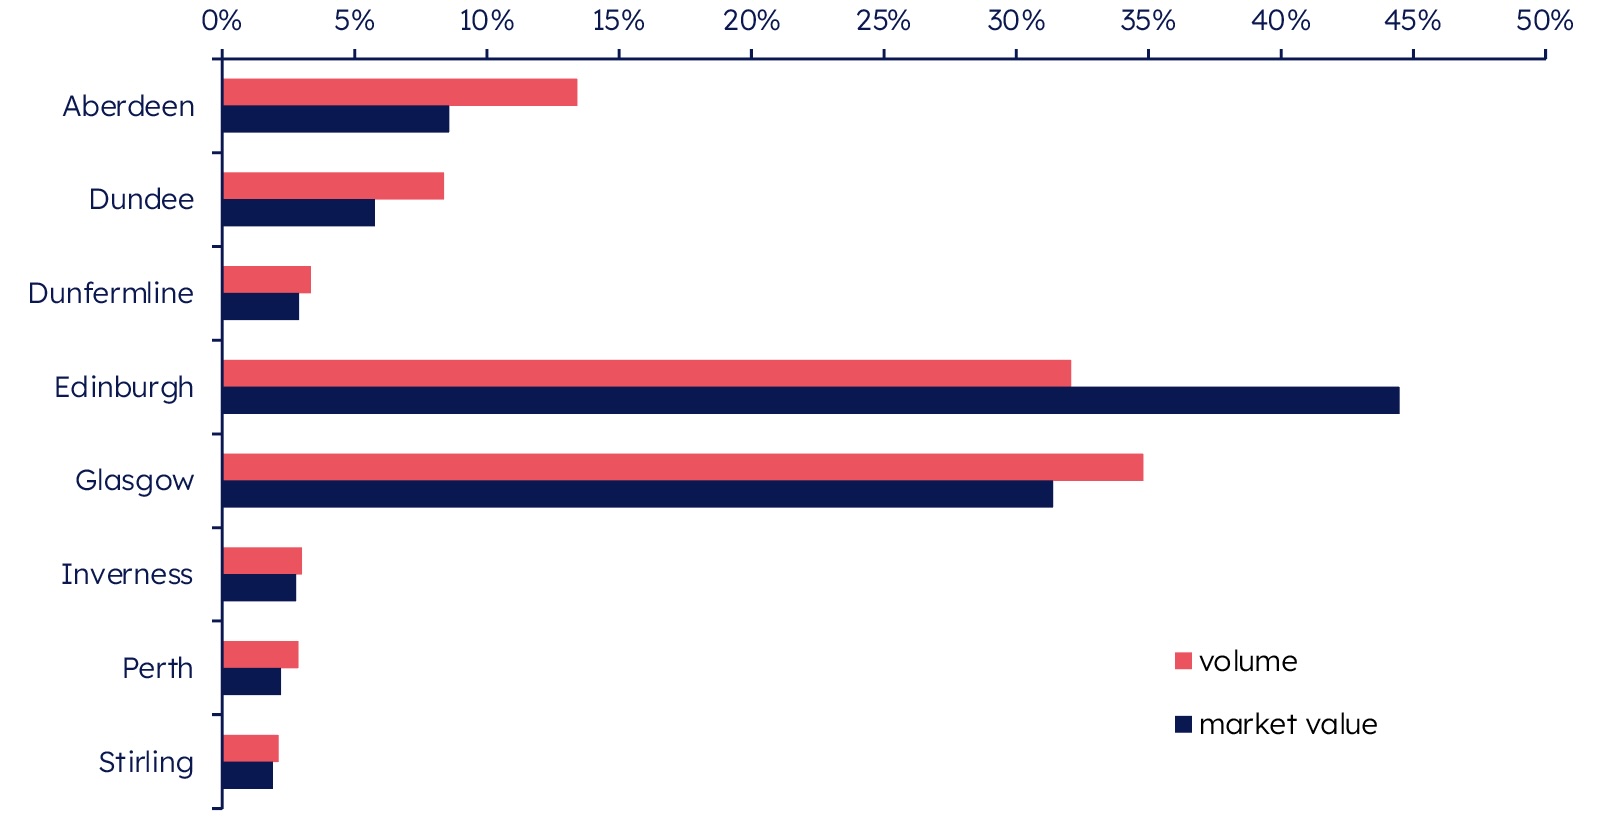
In 2025-26, 30% of all residential property sales in Scotland were in one of the eight cities.
Edinburgh and Glasgow had a similar share of sales in terms of volume in 2025-26 with around a third of city sales happening in both. Edinburgh had a larger share of sales in terms of market value however, accounting for 44% of the residential market value of all cities.
Edinburgh had the highest median price in 2025-26 at £275,000 and Aberdeen had the lowest at £123,500.
More information on this section is available in chapter 1.6 of the full report.
Urban Rural
The Scottish Government Urban Rural Classification 2022 was attached to residential property sales.
Figure 10: Median price by house type and Urban Rural Classification, 2025-26, data table 46.
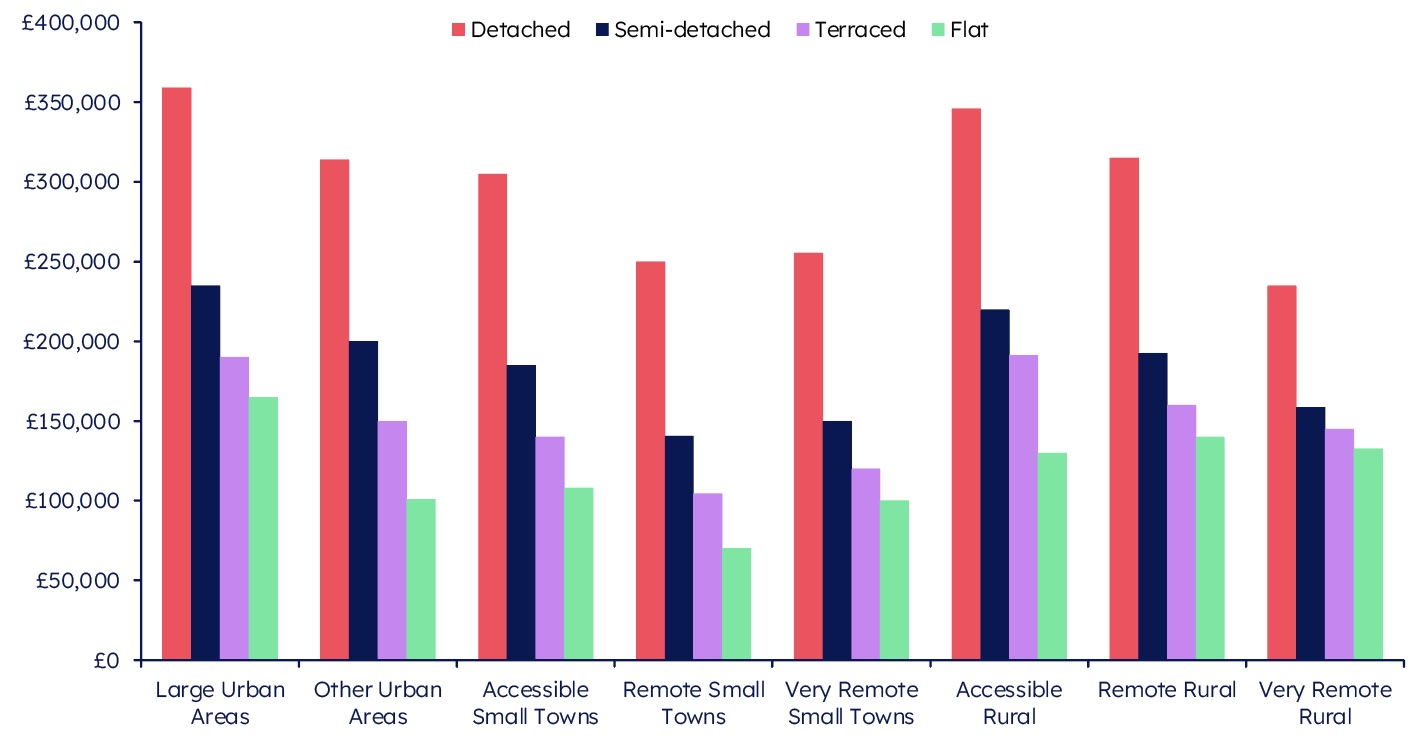
In 2025-26 remote small towns had the lowest median house price for all house types other than detached houses, where the lowest price was in very remote rural areas.
When looking at all house types combined, accessible rural areas had the highest median price of all areas in 2025-26 at £280,500. Remote small towns had the lowest median price in 2025-26 at £129,000 and was the only area to show a drop in median price since 2024-25. Variations in the mix of property types across areas impacts the overall median house prices for urban and rural areas.
More information on this section is available in chapter 1.7 of the full report.
Scottish Island Regions
The Scottish Government Scottish Island Regions geography was used to group Scotland’s islands into nine different island regions.
Figure 11: Scottish island summary, 2025-26, data tables 47-49
| Scottish Island Region | Volume of sales | Median price |
|---|---|---|
| Island total | 1,580 | £185,000 |
| Scotland mainland | 102,828 | £198,000 |
| Scotland | 104,408 | £198,000 |
The median residential property price for the island regions as a whole was £185,000 in 2025-26, compared to £180,000 in 2024-25, which was lower than the median of £198,000 for mainland Scotland.
The median prices varied between the different island regions, ranging from £90,000 in the Shetland Outer Islands to £257,000 in the Highland Islands.
More information on this section is available in chapter 1.8 of the full report.
Non-residential market
The non-residential overview covers commercial sales, commercial leases, and sales of titles that are classified as forestry, agriculture, and land.
Figure 12: Non-Residential Market summary, 2025-26, data tables 50-60
| 2025-26 | Commercial | Forestry | Agriculture | Land |
|---|---|---|---|---|
| Volume of sales | 4,639 | 115 | 674 | 2,256 |
| Market value (£ million) | 3,202 | 65 | 318 | 307 |
| Market value as % of no-residential total | 82% | 2% | 8% | 8% |
In 2025-26, there were:
- 7,684 non-residential sales with a total market value of £3.9 billion
- 4,639 commercial sales, an increase of 2% from 2024-25
- 1,225 commercial leases and assignations submitted for registration, an increase of 2% from 2024-25.
More information on this section is available in chapter 2 of the full report.