Three key figures for March
- £151,856
The average price of a property in Scotland - 1.5%
The annual price change of a property in Scotland - 0.4%
The monthly price change of a property in Scotland
Estimates for the most recent months are provisional and are likely to be updated as more data is included.
Due to the introduction of government measures to reduce the spread of coronavirus (COVID-19) in March 2020, less transactions are available than expected for the March UK House Price Index (UK HPI).
As a result, there may be increased volatility in this month’s estimates, particularly at the lower geographical levels where transaction volumes are smaller.
The UK HPI is based on completed housing transactions.
Typically, a house purchase can take 6 to 8 weeks to reach completion.
Therefore, the price data feeding into the March 2020 UK HPI will reflect those completions that occurred before the government measures to reduce the spread of COVID-19 took hold.
The UK HPI publication from next month (April 2020 due to be released 17 June 2020) is temporarily suspended until further notice (further details below).
The latest provisional statistics from the UK House Price Index (HPI) show that the average price of a property in Scotland in March 2020 was £151,856 – an increase of 1.5 per cent on March 2019.
Comparing with the previous month, house prices in Scotland increased by 0.4 per cent between February 2020 and March 2020.
The UK average house price was £231,855 which was an increase of 2.1 per cent on March 2019 and a decrease of 0.2 per cent on the previous month.
The volume of residential sales in Scotland in January 2020 was 6,860, an increase of 5.3 per cent on the original provisional estimate for January 2019.
This compares with an increase of 1.4 per cent in England, 2.3 per cent in Wales, and an increase of 11.1 per cent in Northern Ireland (Quarter 1 – 2020 compared with quarter in previous year).
In Scotland, detached houses showed the largest increase, rising by 2.5% in the year to March 2020 to £265,208.
Terraced houses showed the smallest increase, rising by 0.9% to £125,480.
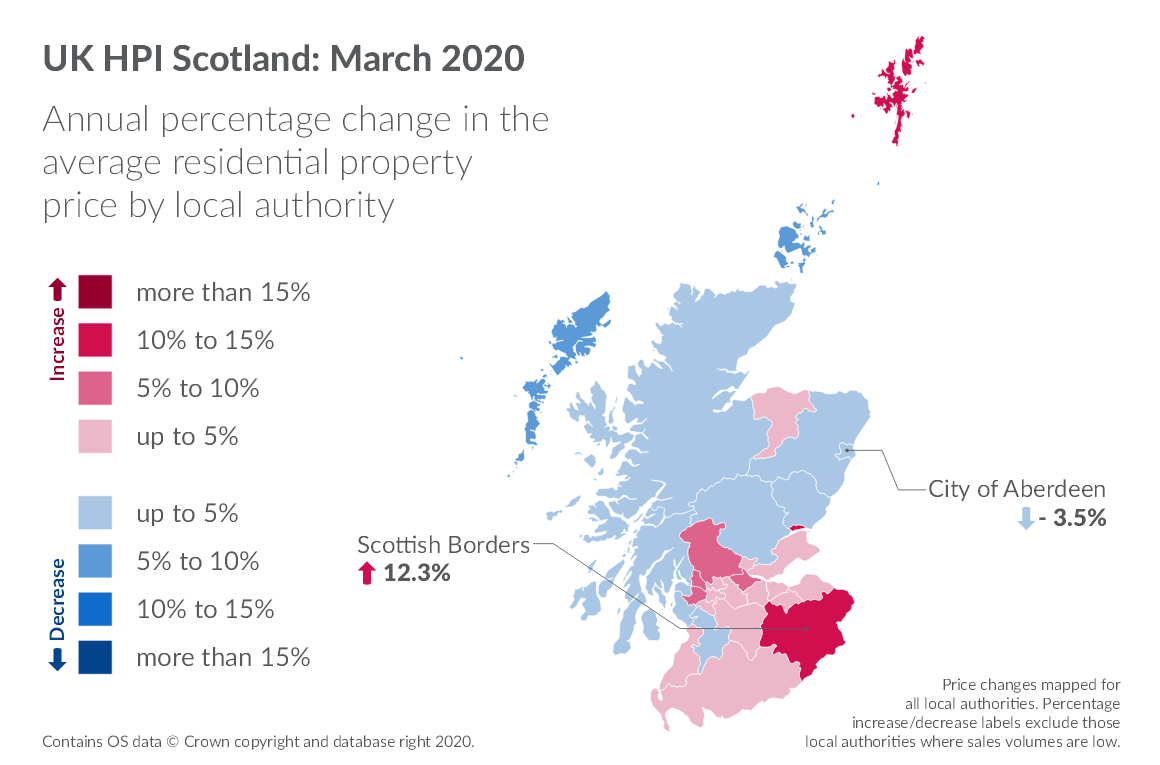
Average price increases were recorded in the majority (21) of local authorities, when comparing prices with the previous year.
The largest increase was in Scottish Borders, where the average price increased by 12.3 per cent to £162,926.
The largest decrease was recorded in City of Aberdeen, where the average price fell by 3.5 per cent to £144,533.
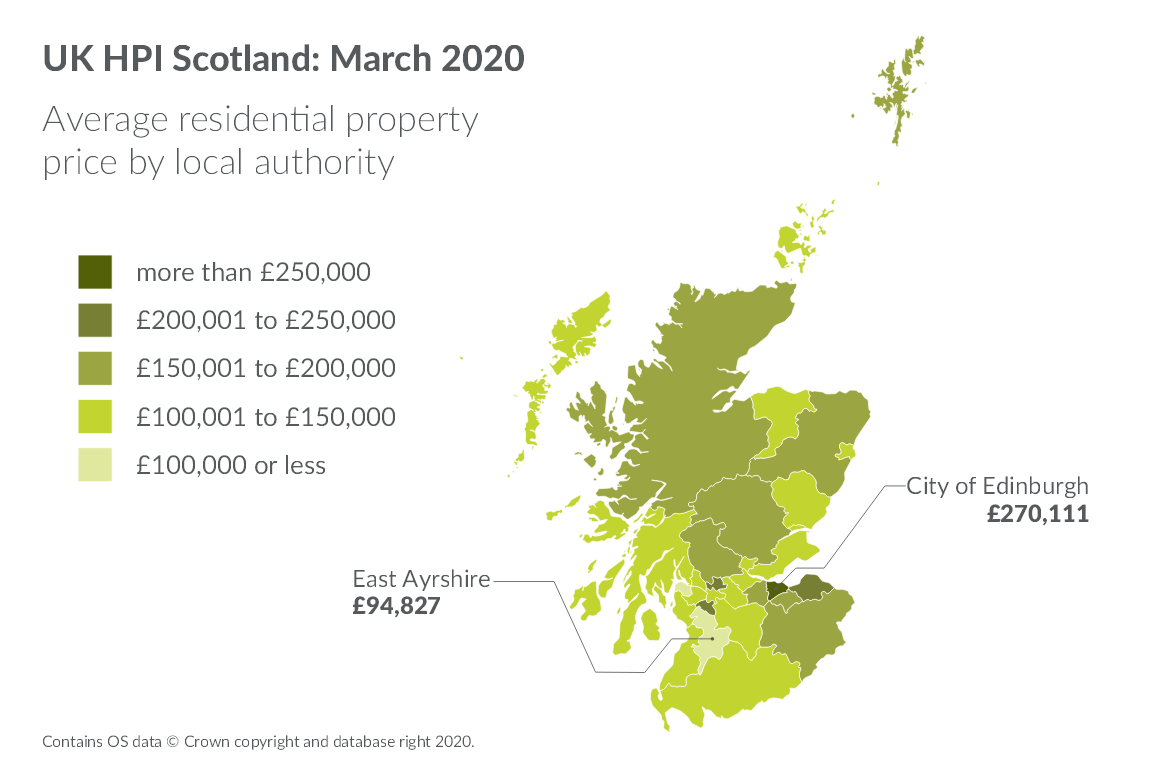
In March 2020, the highest-priced area to purchase a property was City of Edinburgh, where the average price was £270,111.
In contrast, the lowest-priced area to purchase a property was East Ayrshire, where the average price was £94,827.
Further information on HPI Scotland by local authority, property type, first time buyers and cash sales can be found in the latest HPI Scotland publication.
As with other indicators in the housing market, which typically fluctuate from month-to-month, it is important not to put too much weight on one month’s set of house price data.
Notes to editors
- Registers of Scotland is the public body responsible for compiling and maintaining registers relating to property and other legal documents in Scotland. Registers of Scotland records and safeguards the rights of the individual while providing open access to information on the registers.
- The UK HPI is published on the second or third Wednesday of each month with Northern Ireland figures updated quarterly. See the calendar of release dates.
- The statistics have been produced in accordance with the Code of Practice for Statistics. The UK House Price Index is a joint publication with our publication partners: HM Land Registry for England and Wales Land & Property Services Northern Ireland and Office for National Statistics. The UK HPI was designated as National Statistics by the Office for Statistics Regulation on 18 January 2019.
- In response to the ongoing coronavirus (COVID-19) pandemic, the Office for National Statistics and its publication partners have temporarily suspended the UK HPI publication from the April 2020 publication (due to be published 17 June 2020) until further notice.
- The very limited number of housing transactions going ahead while lockdown measures are in place makes it very difficult to produce a meaningful measure of UK house prices. Registers of Scotland and our UK HPI partners will continue to monitor the flow of transaction data with the view to reinstating the UK HPI as early as is practicable. For more details, see the information page here.
- A decision on the publication of Registers of Scotland’s own monthly house price statistics, which are separate from UK HPI and due to be released on 1 June 2020 (showing April 2020 data), will be made once we have more certainty on the data provision.
- Registers of Scotland provides data on residential property sales for the Scotland element of the UK House Price Index. Separate HPI releases are also published by HM Land Registry and Land & Property Services Northern Ireland, which focus on the figures for England and Wales and for Northern Ireland. The Office for National Statistics also publishes a monthly HPI statistical bulletin with commentary on the whole of the UK.
- Details of all of our property statistics releases and future publication dates are available on our website. A comparison guide comparing the different house price index measures that are published in the UK is also available.
- Information on individual property purchase prices is available for free via our ScotLIS service.
- Sign up for our data stats alert service.