Three key figures for October 2020:
- £163,248
The average price of a property in Scotland - 6.0%
The annual price change of a property in Scotland - 1.4%
The monthly price change of a property in Scotland
Estimates for the most recent months are provisional and are likely to be updated as more data is included. The house price index for October 2020 reflects transactions that took place up to the end of October.
Provisional statistics for October
The latest provisional statistics from the UK HPI show that the average price of a property in Scotland in October 2020 was £163,248, an increase of 6.0 per cent on October 2019.
Comparing with the previous month, house prices in Scotland increased by 1.4 per cent between September 2020 and October 2020.
The UK average house price was £245,443 which was an increase of 5.4 per cent on October 2019 and an increase of 0.7 per cent on the previous month.
The volume of residential sales in Scotland in August 2020 was 6,688, a decrease of 33.0 per cent on the original provisional estimate for August 2019. This compares with a decrease of 32.4 per cent in England, 47.7 per cent in Wales, and 22.9 per cent in Northern Ireland (Quarter 3 – 2020 compared with same quarter in the previous year).
Commenting on the house price figures in Scotland, Accountable Officer Janet Egdell said:
“Scottish house prices continue to trend upwards in October, this is the largest annual increase in Scottish house prices since February 2018”
In Scotland, Terraced properties showed the largest increase, rising by 7.1 per cent in the year to October 2020 to £137,374. Flatted properties showed the smallest increase, rising by 4.6 per cent in the year to August 2020 to £115,630.
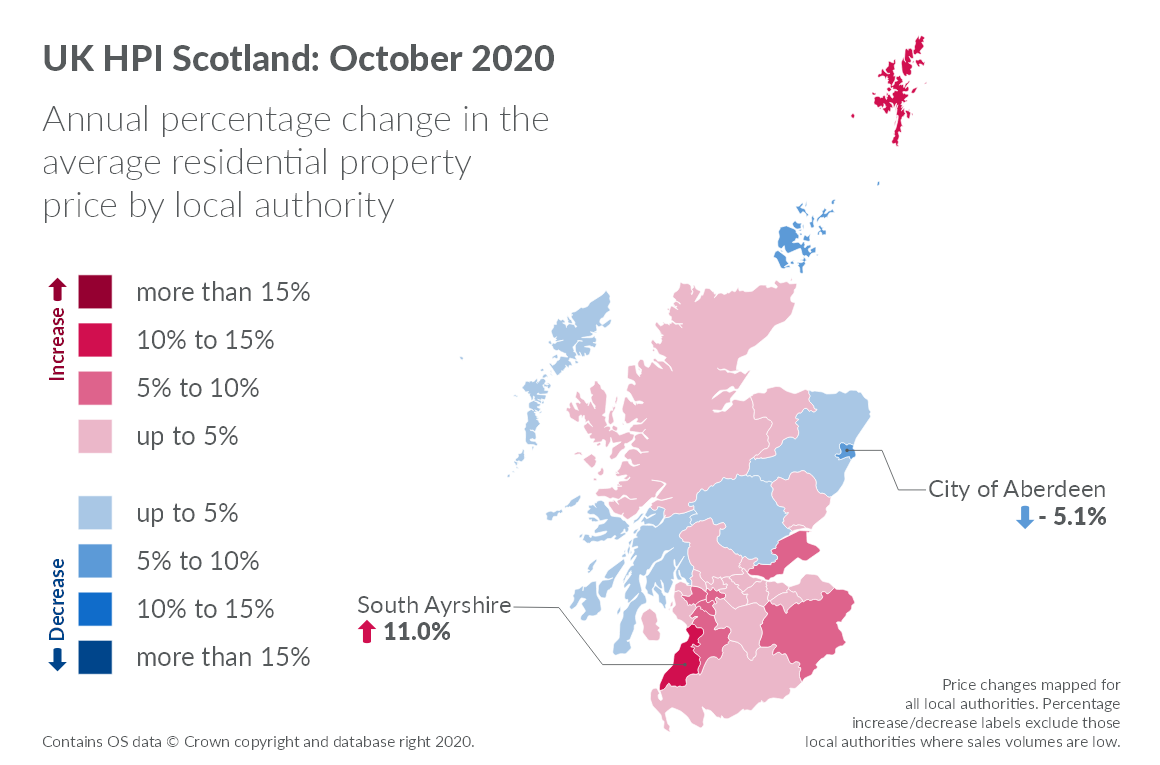
Average price increases were recorded in the majority (26) of local authorities, when comparing prices with the previous year. The largest increase was in South Ayrshire where the average price increased by 11.0 per cent to £151,757. The largest decrease was recorded in City of Aberdeen, where the average price fell by 5.1 per cent to £139,079.
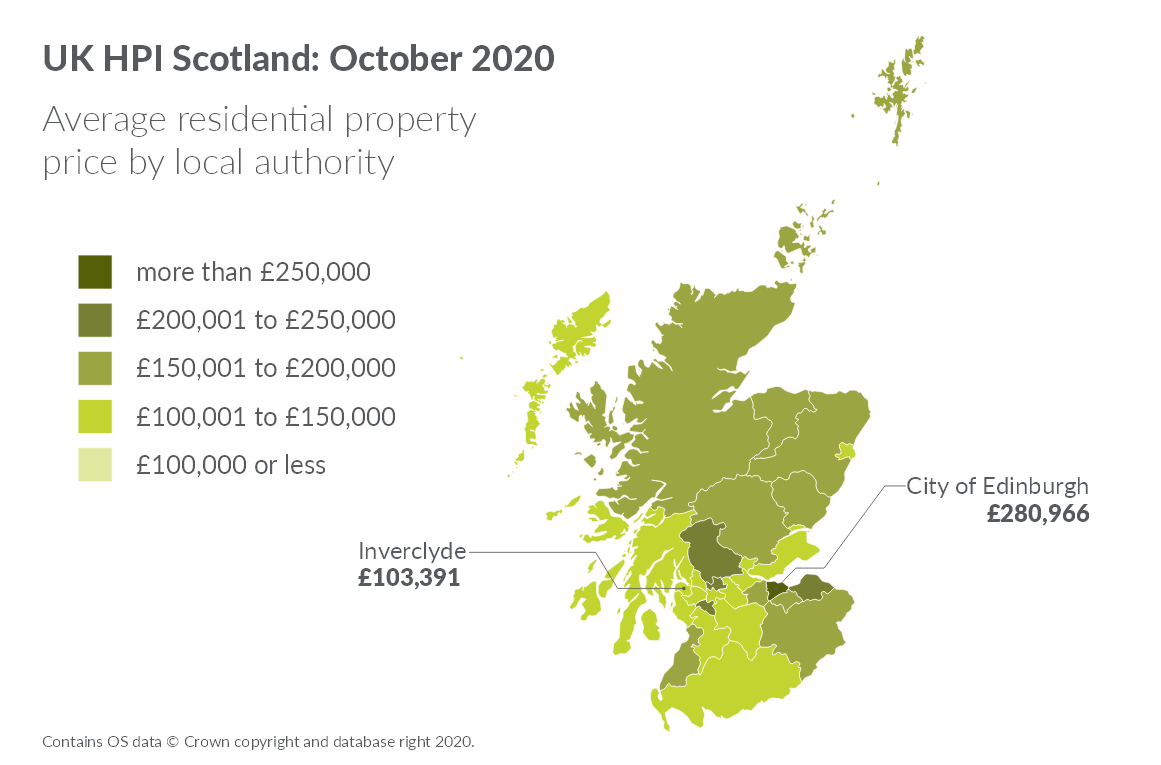
In October 2020, the highest-priced area to purchase a property was City of Edinburgh, where the average price was £280,966. In contrast, the lowest-priced area to purchase a property was Inverclyde, where the average price was £103,391.
Further information on HPI Scotland by local authority, property type, first time buyers and cash sales can be found in the latest HPI Scotland publication.
As with other indicators in the housing market, which typically fluctuate from month-to-month, it is important not to put too much weight on one month’s set of house price data. This has been particularly important over recent months, as COVID-19 has reduced the volume of transactions within the market, making trends between months more volatile than usual and will continue to be important over the coming months as the ongoing impact of COVID-19 on the housing market and the economy becomes clear.
Notes to editors
- Registers of Scotland is the public body responsible for compiling and maintaining registers relating to property and other legal documents in Scotland. Registers of Scotland records and safeguards the rights of the individual while providing open access to information on the registers.
- For the publication schedule for the UK HPI see the calendar of release dates.
- The statistics have been produced in accordance with the Code of Practice for Statistics. The UK House Price Index is a joint publication with our publication partners: HM Land Registry for England and Wales, Land & Property Services Northern Ireland and Office for National Statistics. The UK HPI was designated as National Statistics by the Office for Statistics Regulation on 18 January 2019.
- Registers of Scotland provides data on residential property sales for the Scotland element of the UK House Price Index. Separate HPI releases are also published by HM Land Registry and Land & Property Services Northern Ireland, which focus on the figures for England and Wales and for Northern Ireland. The Office for National Statistics also publishes a monthly HPI statistical bulletin with commentary on the whole of the UK.
- Details of all of our property statistics releases and future publication dates are available on our website. A comparison guide comparing the different house price index measures that are published in the UK is also available.
- Information on individual property purchase prices is available for free via our ScotLIS service.
- Sign up for our data stats alert service.
Footnotes
- All average prices reported from the UK HPI are geometric means, which will typically be closer to the median than the arithmetic mean.↩
- Due to there being a period of 2 to 8 weeks between completion and registration of sales, volume figures based on the month of date of entry are presented up to August 2020 because September 2020 and October 2020 figures are likely to change when more recent sales applications data are received.↩
- Comparison between the latest provisional estimate for August 2020 with the original provisional estimate for August 2019 as recorded before final figures available. The final revised volume of sales in August 2019 was 10,134 an annual decrease of 34.0 per cent in August 2020. However, the sales volume for August 2020 is still subject to revision.↩
- Shetland Islands increased by 14.2 per cent and Orkney Islands decreased by 5.6 per cent. Local authority areas where sales volumes within the 12 months to August 2020 represent less than 1.0 per cent of the all Scotland sales volume are excluded from the figures used for highlighting purposes due to the volatility of the market in these areas.↩