Three key figures for February 2023:
- £180,287
The average price of a property in Scotland - 1.0%
The annual price change of a property in Scotland - -2.6%
The monthly price change of a property in Scotland
Estimates for the most recent months are provisional and are likely to be updated as more data is included. The house price index for February 2023 reflects transactions that took place up to the end of February.
The latest provisional statistics from the UK HPI show that the average price of a property in February 2023 was £180,287, an increase of 1.0 per cent on February 2022.
Comparing with the previous month, house prices in Scotland decreased by 2.6% between January 2023 and February 2023 on a non-seasonally adjusted basis, whilst on a seasonally adjusted basis the decrease in house prices is equal to 0.3%.
Economic commentary is available here.
The UK average house price was £287,506 which was an annual increase of 5.5 per cent on February 2022. Comparing with the previous month, UK house prices decreased by 1.0% between January 2023 and February 2023 on a non-seasonally adjusted basis, whilst on a seasonally adjusted basis the decrease in house prices is equal to 0.3%.
The volume of residential sales in Scotland in December 2022 was 7,735, a decrease of 12.2 per cent on the original provisional estimate for December 2021.
Commenting on the house price and volume figures in Scotland, Kenny Crawford, Registers of Scotland Business Development Director said:
‘’Average house prices for Scotland increased by 1.0 per cent in the 12 months to February 2023. Scotland's annual house price inflation has generally been slowing since the recent peak of 13.8% in the 12 months to April 2022, and has shown slower growth than the average for the UK since July 2022.’’
‘’The volume of transactions for calendar year 2022 were very similar to the pre-pandemic period in 2019.’’
In Scotland, detached properties showed the biggest increase out of all property types, rising by 2.0 per cent in the year to February 2023, to £324,742. Flatted properties were the only property type to show a fall in their average house price, falling by 0.5 per cent in the year to February 2023, to £123,098.
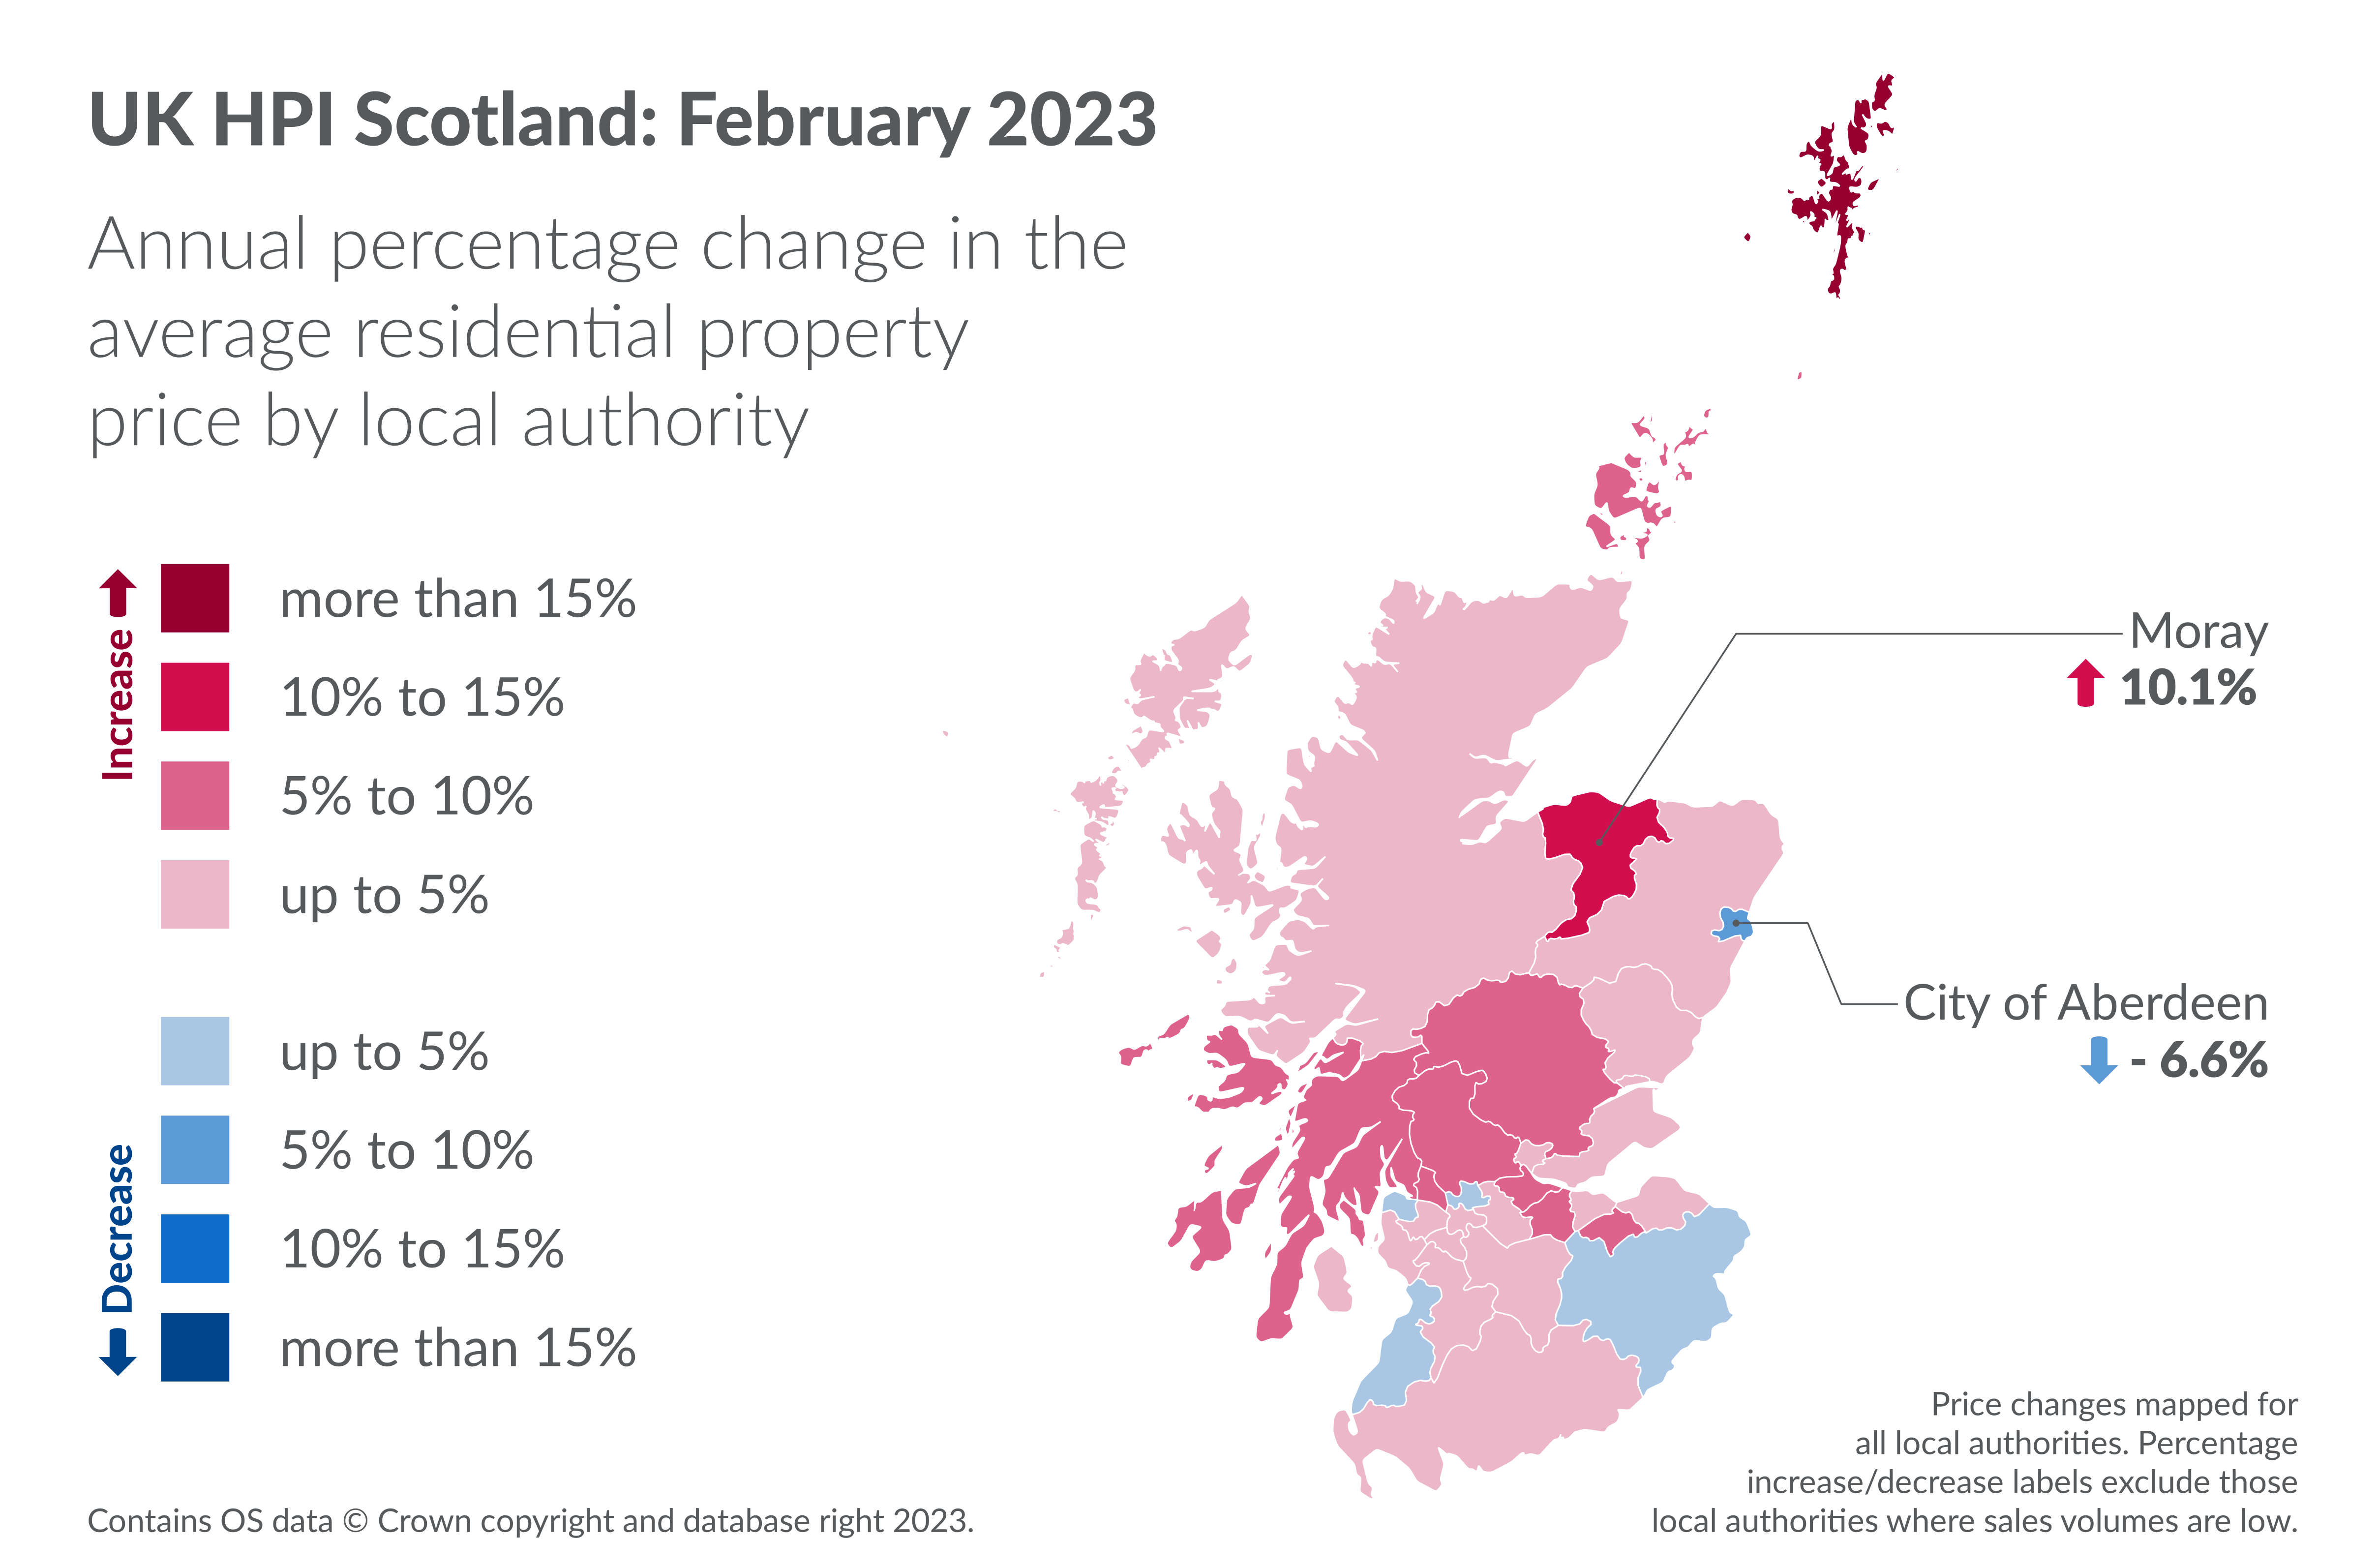
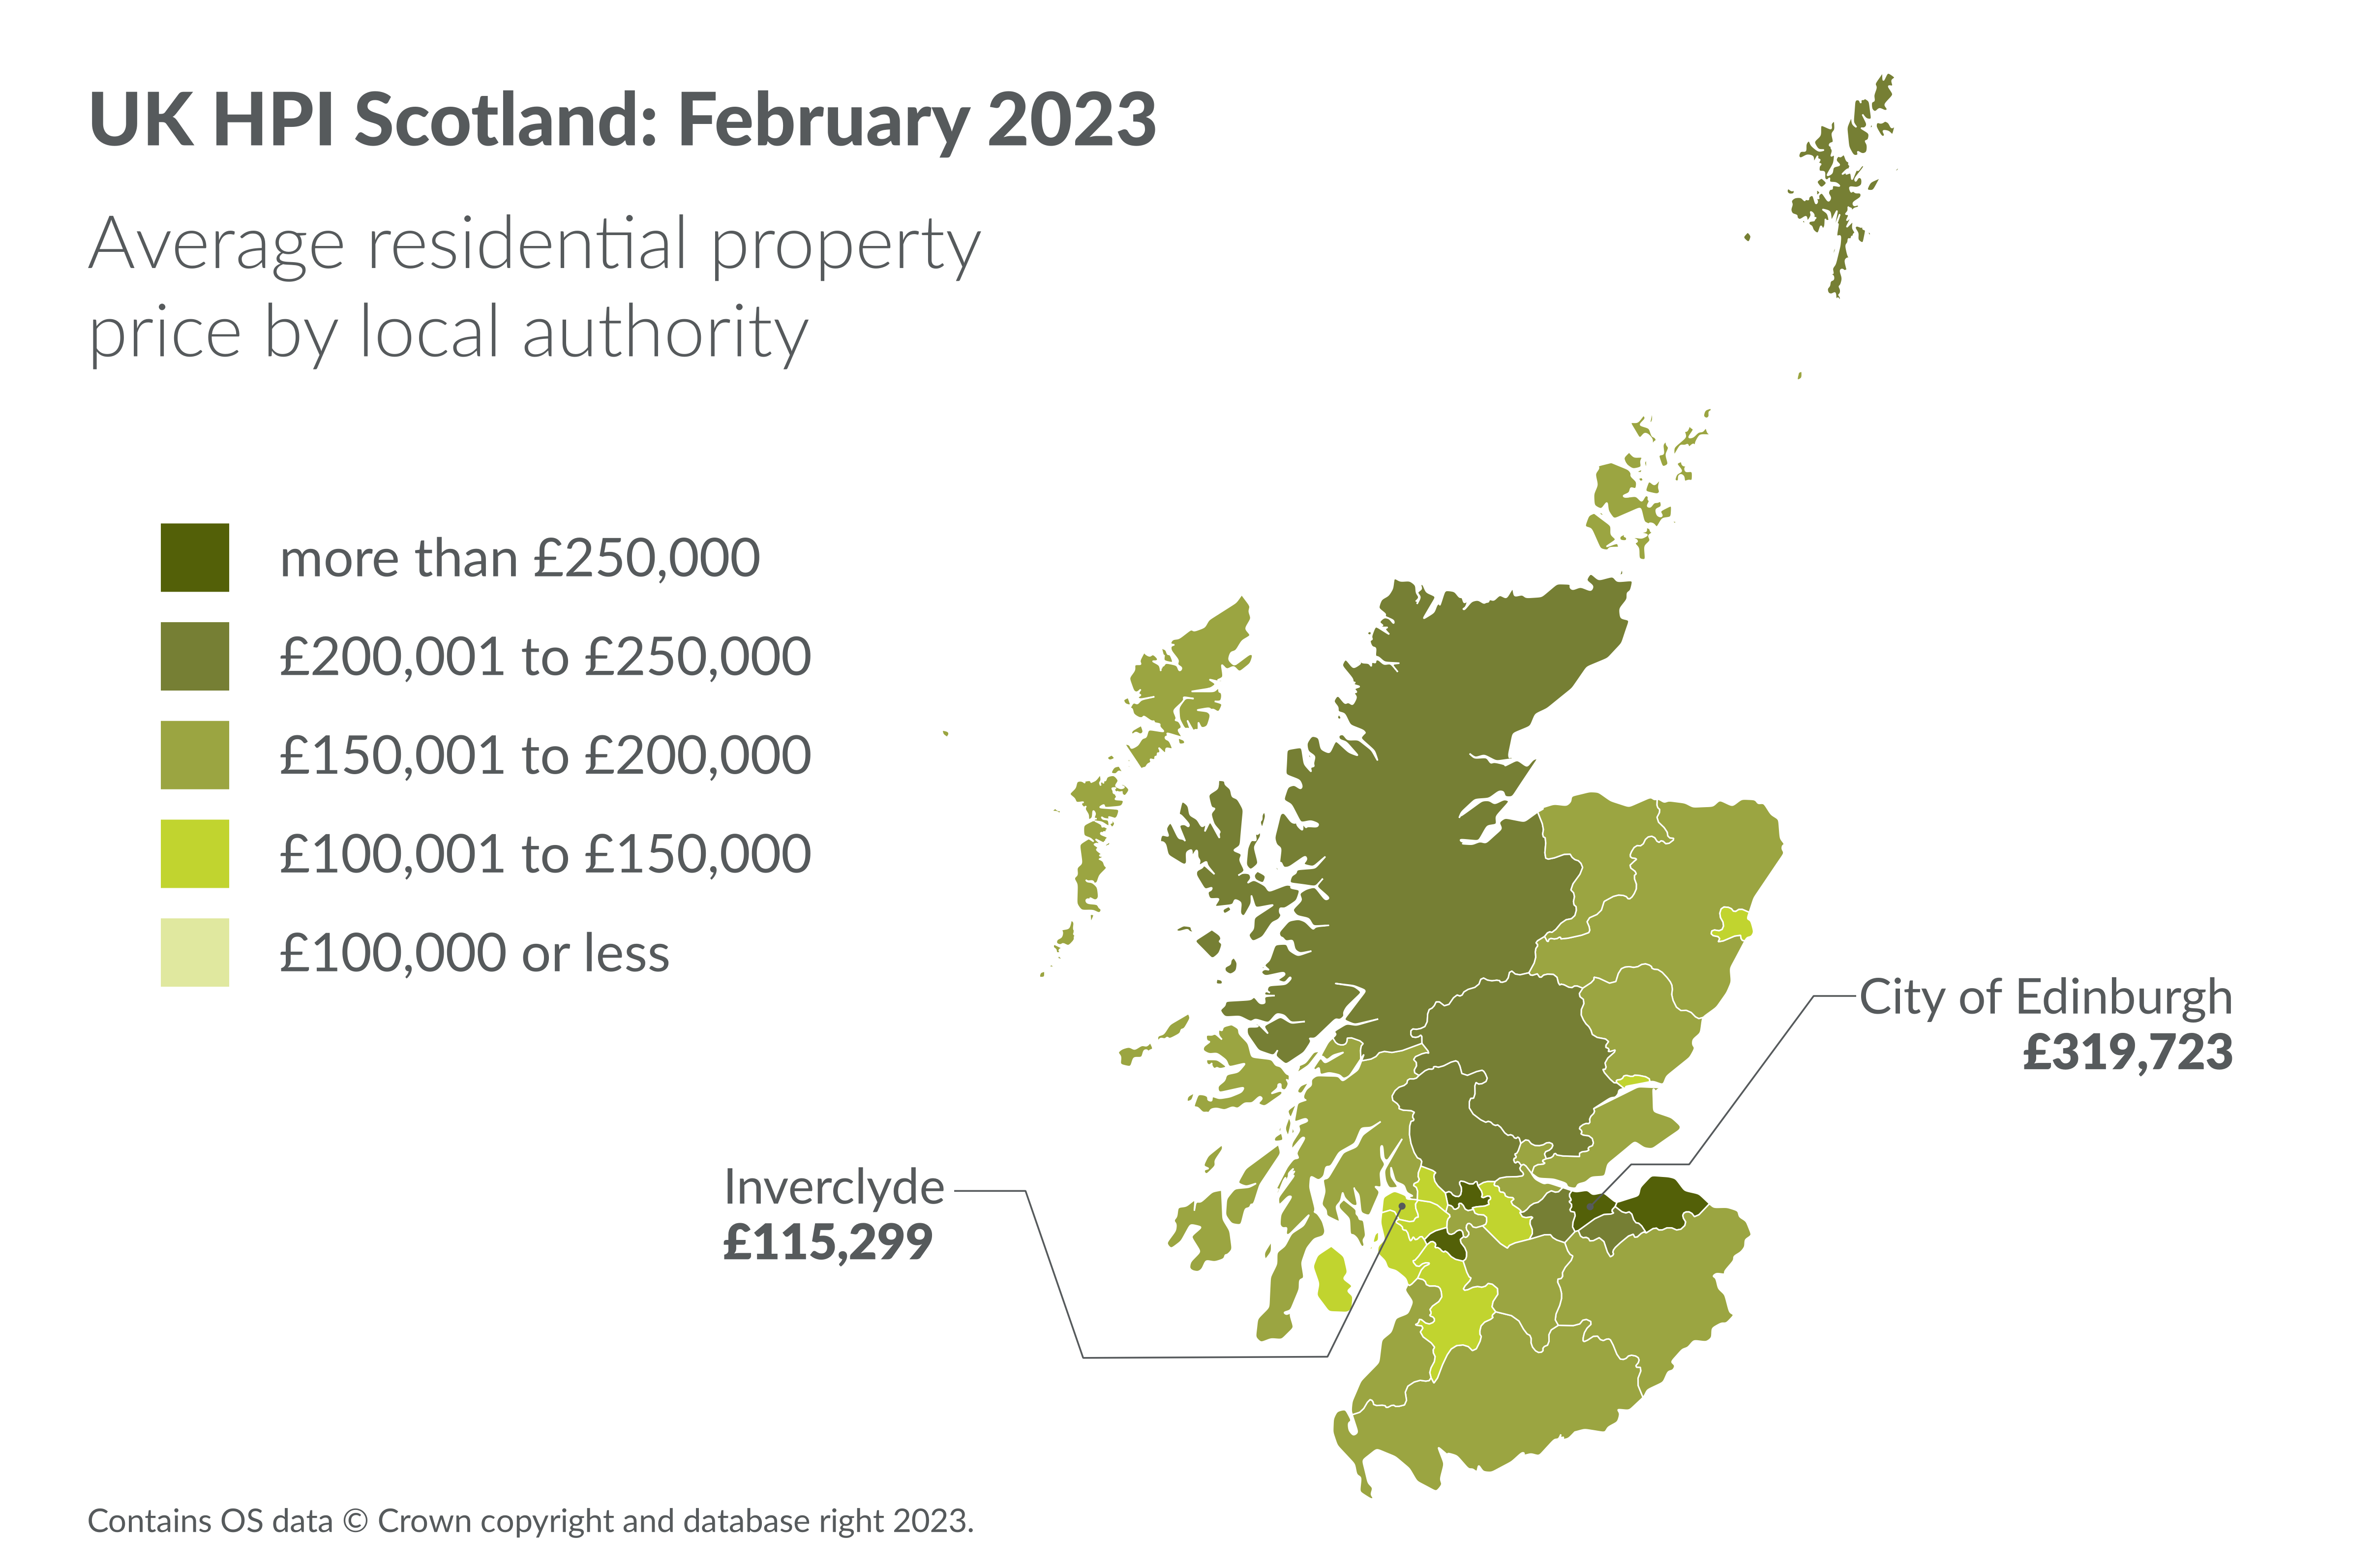
Average prices for Local Authorities are based on a 3-month moving average to help remove some of the volatility in the series. Increases were recorded in 27 out of 32 local authority areas, when comparing prices with the previous year. The largest increase was in Moray where the average price increased by 10.1 per cent to £188,242. The largest decrease was recorded in City of Aberdeen, where the average price decreased by 6.6 per cent to £131,603.
Further information on HPI Scotland by local authority, property type, first time buyers and cash sales can be found in the latest HPI Scotland publication.
As with other indicators in the housing market, which typically fluctuate from month-to-month, it is important not to put too much weight on one month’s set of house price data. This was particularly important in the year from March 2020, as measures to counter COVID-19 affected the volume of transactions within the market, making trends between months and between years more volatile than usual.
Notes to editors
- Registers of Scotland is the public body responsible for compiling and maintaining registers relating to property and other legal documents in Scotland. Registers of Scotland records and safeguards the rights of the individual while providing open access to information on the registers.
- For the publication schedule for the UK HPI see the calendar of release dates.
- The statistics have been produced in accordance with the Code of Practice for Statistics. The UK House Price Index is a joint publication with our publication partners: HM Land Registry for England and Wales, Land & Property Services Northern Ireland and Office for National Statistics. The UK HPI was designated as National Statistics by the Office for Statistics Regulation on 18 October 2018.
- Registers of Scotland provides data on residential property sales for the Scotland element of the UK House Price Index. Separate HPI releases are also published by HM Land Registry and Land & Property Services Northern Ireland, which focus on the figures for England and Wales and for Northern Ireland. The Office for National Statistics also publishes a monthly HPI statistical bulletin with commentary on the whole of the UK.
- Economic commentary is available here.
- Details of all of our property statistics releases and future publication dates are available on our website. A comparison guide comparing the different house price index measures that are published in the UK is also available.
- Information on individual property purchase prices is available for free via our ScotLIS service.
- Sign up for our data stats alert service.
Footnotes
- All average prices reported from the UK HPI are geometric means, which will typically be closer to the median than the arithmetic mean.↩
- Due to there being a period of 2 to 8 weeks between completion and registration of sales, volume figures based on the month of date of entry are presented up to December 2022 because January and February 2023 figures are likely to change when more recent sales applications data are received.↩
- Comparison between the latest provisional estimate for December 2022 with the original provisional estimate for December 2021 as recorded before final figures available. The final revised volume of sales in December 2021 was 8,934 an annual decrease of 13.4 per cent in December 2022. However, the sales volume for December 2022 is still subject to revision.↩
- Shetland Islands increased by 24.5 per cent. Local authority areas where sales volumes within the 12 months to December 2022 represent less than 1.0 per cent of all Scotland sales volume are excluded from the figures used for highlighting purposes due to the volatility of the market in these areas.↩