A review of residential sales recorded by Registers of Scotland.
New build homes accounted for 14% of Scotland’s residential market value in 2024-25, according to the latest analysis from Registers of Scotland (RoS). This blog explores the trends behind these figures and what they reveal about the evolving housing landscape.
Market contribution and sales volume
In 2024-25, new build sales represented approximately 9% of all residential property transactions, contributing £3.2 billion to the total market value. This marks a significant share of the overall residential market.
Changing trends in property types
RoS data shows a notable shift in the types of new build homes being sold. Since the 2008 financial crash, flat sales have declined, and flats now share the smallest portion of the new build market alongside terraced properties. In contrast, detached homes have become more prominent, contributing to rising average prices for new builds.
How RoS tracks new build sales
RoS monitors transactions from builder development titles across Scotland. The figures focus on single residential sales and exclude non-market value transactions, such as transfers between family members or partial property sales.
What’s included and what’s not
The analysis includes most new build transactions but excludes:
- Very small developments or single new builds by private/small-scale builders
- Social housing unless sold as affordable housing at market value
- Build-to-rent properties and purpose-built student accommodation
Additional context from Scottish Government data
For a broader view, Scottish Government statistics provide data on:
- New build starts (foundation stage)
- Completions (when deemed complete by inspectors)
- New housing supply, including rehabilitations and conversions
These figures differ from RoS data, which is based solely on registered residential sales.
Stay updated
Regular updates on new build prices and sales volumes are available on the RoS house price statistics webpage and in the annual Property Market Report, which includes detailed tables and analysis.
Comparing new build sales with sales of existing dwellings
In 2024-25 approximately 9% of all market value residential sales in Scotland were new builds. The market value of these sales is £3.2 billion, which accounts for around 14% of the total value of the residential market.
A comparison of median prices of new build sales compared with existing properties is shown in the table below:
Table 1: Median price of residential properties, by house type in 2024-25
| Detached | Semi-detached | Terraced | Flat | All house types | |
| New builds | £360,000 | £257,000 | £255,000 | £269,000 | £310,000 |
| Existing properties | £305,000 | £195,000 | £150,000 | £132,000 | £180,000 |
The table shows that new build prices are higher across all house types; flats show the biggest price difference, at over twice the median price of existing flat sales.
In addition, the following factors contribute to the difference in median price for all house types combined:
- Detached properties make up the majority of new build sales and detached properties tend to be more expensive than flats.
- Flats make up the majority of sales of existing properties and flats tend to be less expensive than other property types.
This different mix of house types, together with the higher average price of new builds for each house type, explains why new build sales account for a higher proportion of total market value (14%) than total volumes (9%).
These differences are illustrated in Charts 1 and 2 below, and more data on underlying volumes of sales can be found in our annual Property Market Report data table 21.
Trends over time
Chart 1 below shows how the mix of different house types for new build sales has changed over time.
Chart 1: New build sales – percentage of sales by house type, 2003-04 to 2024-25
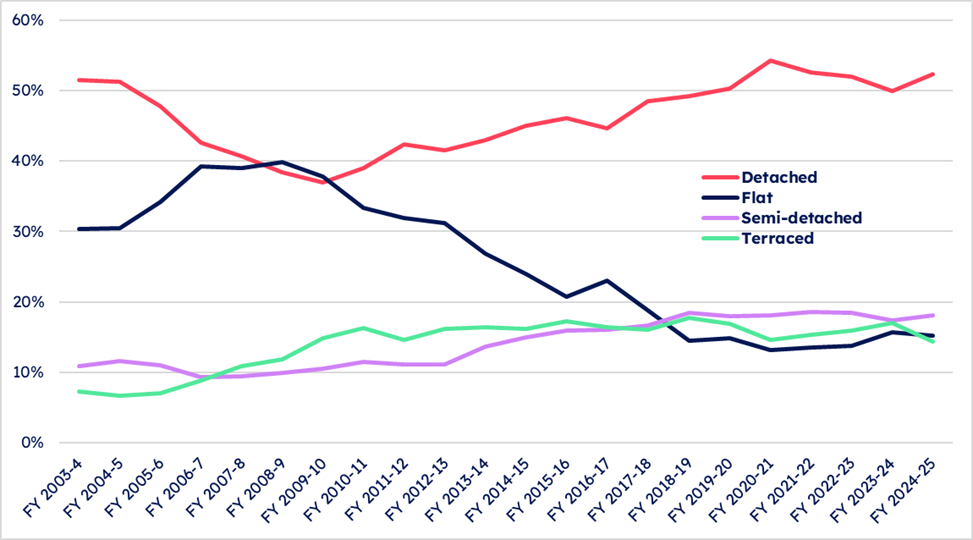
The mix of new build house types has changed over the 2 decades. Before the financial crash in 2008 flats were the 2nd most common house type and immediately prior to the crash the volumes were very close to detached with around a 40% share of sales. However, since 2008-09, the proportion of flat sales has continued to drop and they now have the joint smallest share of the new build market along with terraced houses, at around 15%.
The trends in the mix of new build sales over time could be affected by changes in the volumes of new build properties which are offered for sale; as an example, a rise in the build-to-rent sector may result in more properties (often flats) being built directly for rent rather than being offered for general sale.
Chart 2 shows the mix of house types for existing properties over time.
Chart 2: Sales of existing properties – percentage of sales by house type, 2003-04 to 2024-25
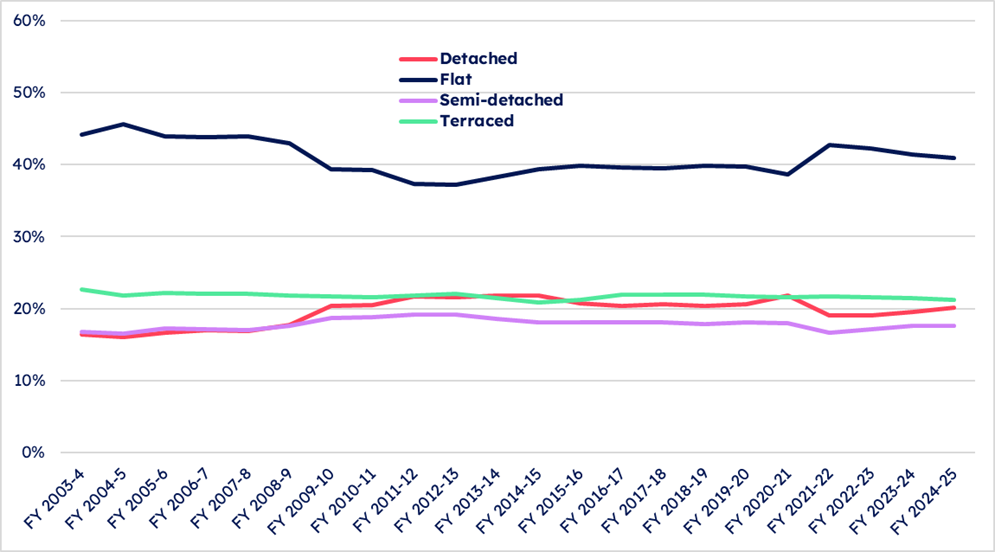
The percentage share of house types for existing properties is quite different to that for new builds and the pattern has remained more static over the 2 decades. Flats have been the dominant house type throughout the time period from 2003-04 to 2024-25, with detached, semi and terraced properties closely matching each other over the period.
Recent trends
Chart 3 below shows recent quarterly data for new build prices and volumes of sales.
Chart 3: New build sales - median price and number of sales, Q1 2023 to Q3 2025

In the latest quarter, July to September 2025, new build prices increased by 3.2% and the volume of sales increase by 8.8%, compared with same quarter in 2024.
More data on new build sale prices and volumes are available in our latest house price statistics and data visualisations.
We welcome feedback on our property data and statistics to help us improve our work.
Contact us at statistics@ros.gov.uk with any comments.