Property Market Report 2020-21
Published: 28 June 2021Freedom of information class: How we're performing
Our property market report is published annually.
Documents
Property-Market-Report-2020-21.pdf - (5.3 MB)Property-Market-Report-2020-21-Data-Tables.xlsx - (481.4 KB)
Keeper's introduction
It has been another busy year at Registers of Scotland (RoS) and one in which we have worked hard to deliver the best service possible for our customers and stakeholders.
As the guardians of 20 of Scotland’s public registers – including the oldest national public land register in the world - RoS plays a pivotal role in the Scottish economy.
We provide a publicly guaranteed system of rights in land and property, underpinning a multi-billion pound asset base of land and property in Scotland and giving people the confidence to invest.
We are also an authoritative voice on Scotland’s land and property market, producing relevant data and analysis on this. This information is used to improve decision making, stimulate research, and inform debate both in the public and private sectors.
Our Property Market Reports are a key component of this work and ensure that we, alongside the wider public, are able to better understand trends in the Scottish property market and economy.
This year’s report provides an overview of the residential and non-residential property markets, and demonstrates, once again, that we offer the most comprehensive and accurate property data in Scotland.
Highlights from 2019-20 showed that the average price of a residential property in Scotland was £182,357 and that 27 per cent of all residential properties sold were located within on of Scotland's seven cities.
The total value of the residential sales market was £18.5 billion in 2019-20 while non-residential sales had a total market value of £3.7 billion.
These figures not only highlight just how important this sector is to Scotland’s economy but also why it is so vital that we as an organisation produce this data.
In addition to this report, we continue to be a key contributor to the UK House Price Index (UK HPI) – a recognised National Statistic by the Office for Statistics Regulation (OSR).
This accreditation is significant in confirming that the Index has been independently assessed and meets the highest levels of trustworthiness, quality and value as defined in the Code of Practice for Statistics.
While the publication of the index has been temporarily suspended due to the Coronavirus (Covid-19) pandemic limiting housing market activity during lockdown, this will be restarted as soon as there is sufficient data for this to happen.
In the meantime, we are continuing to publish our own data on the number of housing transactions completed each month in order to provide an insight into the impact that lockdown is having on the numbers of properties being bought and sold across Scotland.
At RoS, customers are at the heart of everything we do so I am pleased that we have been able to develop ScotLIS – Scotland’s Land Information Service – even further this year too.
Citizens are now able to directly download title sheets from the Land Register, rather than having to request these via our customer services function.
This self-service approach has enabled us to significantly reduce the price for members of the public accessing information from the register as well as make searching for property information both quicker and more accessible.
More widely, we remain committed to completing the Land Register and to the ongoing evolution of new services which support data driven innovation and new economic activity.
In the past year, we launched Geovation Scotland in partnership with Ordnance Survey (OS).
This innovative project supports Scottish-based start-ups who identify how RoS data, combined with other geospatial and property data, can be used to solve problems and deliver value to businesses in Scotland.
The inaugural open call for programme applications received responses from over 32 Geotech and Proptech start- ups from across the country with the three companies selected working within factoring, eco-tourism and forestry.
I am proud that my team have delivered so many highlights in the past year but there have, of course, been challenges too. Not least, the ongoing effects of the Covid-19 health emergency.
A key focus for RoS in the year ahead will be how we mitigate the pandemic’s impact on the Scottish economy and housing market.
Organisations in all sectors will have to adapt to a new and unfamiliar landscape and the formidable challenges that lie ahead.
I am confident that our unparalleled expertise, and the progress we have made during the period of lockdown in delivering safe, efficient digital solutions, supporting our colleagues and customers, and bringing reassurance to the property sector, means RoS can play a pivotal role in these uncertain times.
The stability that we bring in securing the land and property rights of the citizens of Scotland,and our proven track record as innovators and pioneers, means RoS are ideally placed to underpin Scotland’s economic recovery and help drive its long-term success.
Jennifer Henderson, Keeper of the Registers of Scotland
Main findings
Table 1: Summary of residential market, Scotland, 2019-20, financial year data
| 2019-20 | 1 year percentage change (2018-19 to 2019-20) | 5 year percentage change (2014-15 to 2019-20) | 10 year percentage change (2009-10 to 2019-20) | |
|---|---|---|---|---|
| Average residential property price (£) | 182,357 | 1.9 | 9.0 | 20.4 |
| Volume of residential property sales | 101,664 | 0.1 | 9.9 | 41.5 |
| Value of residential property sales (£ billion) | 18.5 | 2.0 | 19.8 | 70.3 |
Residential market (sales from £20,000 to £1 million)
Fewer transactions were received by RoS than expected in March 2020 because of the introduction of government measures to reduce the spread of the coronavirus (COVID-19).
The number of residential property sales registered with RoS in March 2020 was 5,765, a 14 per cent decrease when compared with March 2019.
The average price of a residential property in Scotland in 2019-20 was £182,357, an increase of 18 per cent when compared with the pre-financial crash average price of £154,820 in 2007-08, and an increase of 1.9 per cent when compared with the 2018-19 average price of £179,012.
The highest average price was achieved in the second quarter of 2019-20 at £185,063.
The volume of residential sales in 2019-20 was 101,664, a decrease of 32 per cent when compared with the peak year 2006-07 (150,445 sales), and an increase of 0.1 per cent when compared with 2018-19.
The greatest quarterly volume of residential sales between 2003-04 and 2019-20 was 42,305 sales in the second quarter of 2007-
08. The quarter with the lowest volume of sales was the fourth quarter of 2008-09 with 11,690 sales.
The total value of the residential sales market was £18.5 billion in 2019-20, an increase of 2.0 per cent when compared with 2018-19.
The market value has been increasing every year since 2012-13, but remains 20 per cent below the pre-financial crisis peak in 2007-08.
House type and price band
In 2019-20, detached properties had the highest average price of all house types (£271,010) and consequently the largest share of the residential sales market (33 per cent) with a sales value of £6.1 billion.
Flatted properties showed the largest volume of residential sales of all house types, with 36,813 sales in 2019-20.
In 2019-20, four out of five (79 per cent) residential sales had a price between £20,000 and £250,000.
There has been a shift toward higher priced residential property from 2006-07 (peak year in terms of residential property sales) to 2019-20.
The volume of sales has increased in all price bands over £250,000, despite the overall volume of sales having decreased by 32 per cent between 2006-07 and 2019-20.
New build residential market
The average price for a new build residential property in Scotland in 2019-20 was £258,272, a 3.5 per cent increase when compared with the previous year (£249,656).
This continues the generally upward trend seen in the last 10 years.
The volume of new build sales (12,257) in Scotland was 34 per cent lower in 2019- 20 than the pre-financial crisis peak level in 2007-08 (18,536 sales), although new build sales are 62 per cent higher than the lowest point of the market in 2011-12 (7,585 sales).
Of the 101,664 residential property sales in the £20,000 to £1 million price range in 2019-20, 12 per cent (12,257 sales) were
new builds.
In 2019-20, there were 36 new build sales for over £1 million, the highest since the start of this report in 2003-04.
The value of the new build residential property market in Scotland increased to £3.2 billion in 2019-20, a growth of 4.0 per cent compared with 2018-19.
High value residential market in terms of sales (sales over £1 million)
The average price of a property sold for over £1 million in 2019-20 was £1.45 million.
There were 255 high value sales in 2019-20, an increase of 80 sales compared with 2018- 19. This represented the highest volume of sales since the previous peak of 229 sales in 2007-08.
High value residential property sales in 2019-20 accounted for 0.2 per cent of all residential property sales in Scotland.
The City of Edinburgh local authority area consistently held around half of all sales over £1 million until 2017-18 when the city’s
share increased to two thirds (72 per cent share in 2019-20).
City property market
In Scotland, 27 per cent of all residential properties sold in 2019-20 were located within one of Scotland’s seven cities.
The average price paid for a residential property in one of Scotland’s seven cities in 2019-20 was £194,248, 6.5 per cent higher than the Scotland average price for the same year.
The market value for residential sales in all seven cities for 2019-20 was £5.4 billion, 3.3 per cent lower than 2018-19 (£5.6 billion).
This compares with a residential market value of £18.5 billion across the whole of Scotland in 2019-20.
Mortgage market
In 2019-20, 70,724 residential sales were registered with a mortgage, a fall of 44 per cent when compared with 2007-08 (peak year for mortgage sales).
In 2019-20, cash sales accounted for 30 per cent of the 101,664 residential sales in Scotland.
This compares with 16 per cent in 2007-08, the lowest proportion of cash sales between 2003-04 and 2019-20.
A total of 136,111 securities were registered in the Land Register in 2019-20 across all property types, including both mortgage sales and additional borrowing.
This is a decrease of 49 per cent when compared with 2006-07 (the height of the market) and an increase of 3.7 per cent when compared with 2018-19.
Non-residential overview
Non-residential sales had a total market value of £3.7 billion in 2019-20.
Of this total, 81 per cent were commercial sales, 10 per cent related to sales of land, 6.3 per cent were agricultural sales and 2.4 per cent were forestry sales.
There were 4,156 commercial sales in 2019-20, an increase of 56 per cent from the lowest point in 2012-13 (2,663 sales), but a decrease of 23 per cent and 10 per cent respectively when compared with the sales peak in 2007-08 (5,392 sales) and with 2018-19 (4,624 sales).
There were 750 commercial leases in 2019-20, an increase of 4.6 per cent when compared with 2018-19. The volume of commercial leases was 36 per cent lower in 2019-20 than the highest point of the market in 2007-08 when there were 1,178 leases.
Residential property sales by urban rural classification
In 2018-20 (two years of data combined to reduce volatility in the series), 81 per cent of residential property sales in Scotland were in urban areas and 19 per cent in rural areas.
The average price of a residential property in urban areas of Scotland in 2018-20 was £167,313 compared with £210,754 in rural
areas.
In 2018-20, the average residential property price for urban areas was highest in the City of Edinburgh and lowest in East Ayrshire.
For rural areas, the highest price was in East Renfrewshire and the lowest in Na h-Eileanan Siar.
Things you need to know about this report
These statistics are compiled using data collected as part of the statutory land registration process.
The data is extracted based on the date of registration, i.e. the date that the application for registration is received by Registers of Scotland (RoS), rather than on the date of entry contained within the application.
This data is comprehensive, covering transactions across the whole of Scotland for all types of property sales, in residential and non-residential markets, and with actual sale prices, not just valuations.
Coronavirus (COVID-19)
Fewer transactions were received by RoS than expected in March 2020 because of the introduction of government measures to reduce the spread of the coronavirus (COVID-19).
Take caution when interpreting these statistics and comparing them with previous time periods.
More information is available in the background and contact information section.
The data tables used in this report are available to download.
In July 2019, we ran a user feedback survey on the data and statistics we publish and hosted a data and statistics user day in November 2019.
Further information about RoS data and statistics.
RoS also publishes data for the Scottish component of the UK House Price Index (UK HPI).
The statistics presented here are distinct from the UK HPI with differences in methodologies including date range of extraction, price range and type of average used.
While the trends are broadly similar, the resulting average residential house price figures reflect the different methodologies used.
Residential market
This section looks at residential sales between £20,000 and £1 million².
Volume of sales
The total volume of residential sales across Scotland decreased by 32 per cent from 150,445 sales in 2006-07 (peak year) to
101,664 sales in 2019-20.
This was largely driven by a substantial decrease in the volume of sales following the financial crisis.
The sales volume in Scotland has risen by 44 per cent since the low of 70,504 sales in 2011-12.
The number of residential property sales registered with RoS in March 2020 was 5,765, a 14 per cent decrease when compared with
March 2019.
There was an increase of 0.1 per cent when compared with 2018-19 (chart 1, online table 2).
The decrease in sales from 2006-07 to 2019-20 was reflected in all areas of Scotland, with the exception of Midlothian where there was an increase of 5.5 per cent from 1,788 sales to 1,886 sales³.
Aberdeen City showed the largest decrease (50 per cent).
In 2019-20, Glasgow City and City of Edinburgh local authority areas had the largest sales volumes with 11,677 and 11,092 sales respectively, each accounting for 11 per cent of all sales in Scotland.
The volume of sales in Aberdeen has been affected by the downturn of the oil industry in recent years, with the number of sales in Aberdeenshire and Aberdeen City falling by 30 per cent and 27 per cent respectively between 2014-15 and 2019-20.
Chart 1: Volume of residential property sales, Scotland, 2003-04 to 2019-20, financial year data (online table 2)
Average price
The average price of a residential property in Scotland in 2019-20 was £182,357, an increase of 18 per cent when compared with the pre-financial crash average price of £154,820 in 2007-08, and an increase of 1.9 per cent when compared with the 2018-19 average price of £179,012.
Since 2003-04, the start of RoS house price data, the average residential property price has increased by 81 per cent (chart 2, online table 3).
Midlothian and East Dunbartonshire saw the largest rises in the average residential property price between 2007-08 and 2019-20 both with an increase of 35 per cent to £227,396 and £261,574 respectively⁴.
In the same period, the largest decrease was in South Ayrshire, with a 2.8 per cent reduction in the average price, from £160,949 to £156,394.
East Dunbartonshire had the largest increase in the average price over the previous financial year, rising by 7.8 per cent from £242,589 in 2018-19 to £261,574 in 2019-20.
South Ayrshire recorded the largest decrease, reducing by 2.2 per cent from £159,932 to £156,394⁵.
The City of Edinburgh has had the highest average price in the majority of years. Since 2005-06, the average price in the City of
Edinburgh has only been surpassed in three years.
In both 2016-17 and 2017-18 East Renfrewshire recorded the highest average price, and in 2013-14 both Aberdeenshire and East Renfrewshire exceeded the capital’s average price.
Average prices in Aberdeen have been affected by the downturn of the oil industry, with average prices in Aberdeen City and
Aberdeenshire decreasing between 2014-15 and 2019-20 by 11 per cent to £194,628 and 9.2 per cent to £211,111 respectively.
Both Aberdeen City and Aberdeenshire also showed a decrease over the past year of 1.0 per cent and 0.7 per cent respectively.
Chart 2: Average residential property price, Scotland, 2003-04 to 2019-20, financial year data (online table 3)

Market value
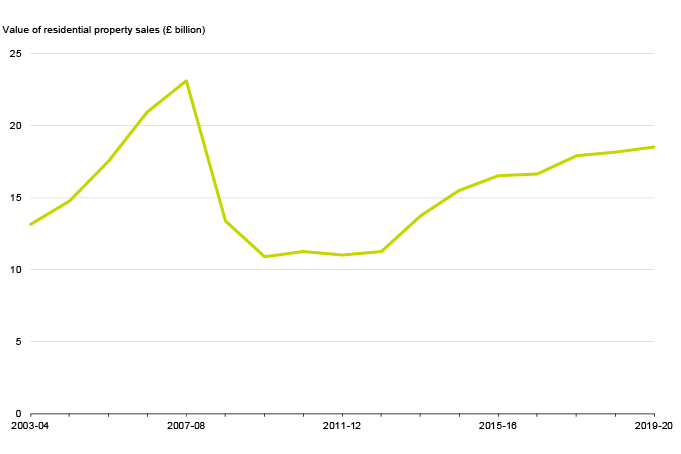
The value of the residential property sales market in Scotland was £18.5 billion in 2019-20, an increase of 2.0 per cent when compared with 2018-19.
The market value has been increasing every year since 2012-13, but remains 20 per cent below the pre-financial crisis level peak in
2007-08 (£23.1 billion).
The market value has increased by 70 per cent between 2009-10 (the lowest point in terms of market value following the financial crisis) and 2019-20 (chart 3, online table 4).
Although the value of the residential property sales market in Scotland has decreased between the pre-financial level peak in 2007- 08 and 2019-20, a number of local authorities have shown increases in the market value of residential sales over this time:
- Midlothian, up by 29 per cent
- East Dunbartonshire, up by 10 per cent
- East Renfrewshire, up by 9.3 per cent
- East Lothian, up by 5.6 per cent
This is due to a combination of substantial average price increases together with smaller falls in volume of all local authorities over this time period6.
The largest decreases were in Aberdeen City and East Ayrshire, which saw their market value fall by 41 per cent and 40 per cent respectively between 2007-08 and 2019-20.
This is due to a large decrease in the volume of sales, combined with a small increase in average price in the case of Aberdeen City and a decrease in average price in East Ayrshire.
Chart 3: Value of residential property sales, Scotland, since 2003-04, financial year data (online table 4)

Quarterly analysis
Quarterly analysis reveals seasonal trends in the housing market across the year.
The highest quarterly volume of sales was in the second quarter of 2007-08 with 42,305 sales.
The quarter with the lowest volume of sales between 2003-04 and 2019-20 was the fourth quarter of 2008-09 with 11,690 sales.
Fewer transactions were received by RoS than expected in March 2020 because of the introduction of government measures
to reduce the spread of the coronavirus (COVID-19).
The volume of residential property sales registered with RoS in the fourth quarter of 2019-20 was down by 5.7 per cent when compared with the same quarter of the previous year.
Between 2003-04 and 2019-20, the highest quarterly average price was achieved in the second quarter of 2019-20 at £185,063.
The average price in the third quarter was £184,641.
Chart 4 shows the average price by quarter since 2003-04, highlighting the seasonal trends in the residential property market (see online tables 5 to 7 for additional quarterly data on market value and sales volume).
Chart 4: Average residential property price, Scotland, 2003-04 Q1 to 2019-20 Q4, quarterly financial year data (online table 6)

House type and price band
Residential property sales in Scotland are assigned to one of four house types (detached, semi-detached, terraced and flatted properties) through a GIS-based classification system developed by RoS⁷.
A substantial number of sales cannot at this stage be assigned to a house type. This is primarily due to time lags between a title being received for registration and the updating of the map base, particularly for new build properties.
Unassigned sales account for 6.7 per cent of sales for 2019-20 but this typically decreases as applications are completed and more information becomes available (there are currently 3.7 per cent unassigned in 2018-19 and less than 3.0 per cent for earlier years).
The proportion of all sales that remain unassigned in 2019-20 could skew any resulting analysis and remain provisional (as well as 2018-19).
Caution should be applied when using the house type statistics.
The volume of sales by house type is presented with these unassigned sales allocated to house types using historic data.
This is the same method that is used to adjust our quarterly house price statistics⁷.
Average price by house type and market value by house type cannot be adjusted in the same way, and are therefore presented showing unassigned sales separately from the house type figures.
Volume of sales
The following analysis on the volume of residential sales by house type is based on figures where unassigned sales have been allocated to house types using historic data.
The series of unadjusted figures, showing unassigned figures separately, is available in online table 9.
Flatted properties showed the highest volume of residential sales in Scotland of all house types in 2019-20 with an estimated 36,813
sales.
The lowest volume was for semi-detached properties with 18,561 sales.
Since 2006-07 (peak year in terms of residential property sales), sales volumes of all house types have fallen, with flatted properties
recording the largest decrease at 43 per cent when comparing 2019-20 with 2006-07.
Detached properties had the smallest decrease at 19 per cent.
Between 2018-19 and 2019-20, the change in volume of residential sales in Scotland varied by house type.
Detached and semi-detached properties saw an increase in the volume of sales with both rising by 1.7 per cent.
Flatted and terraced properties saw a decrease in volume of sales with falls of 0.5 per cent and 1.8 per cent respectively (table 2 and online table 8).
Table 2: Volume of residential property sales by house type (RoS methodology), Scotland, 2006-07, 2018-19 and 2019-20 financial year data (online table 8)
| House type | Peak year (2006-07) | 2018-19 | 2019-20 | Percentage change 2018-19 to 2019-20 | Percentage change 2006-07 to 2019-20 |
|---|---|---|---|---|---|
| Detached | 30,654 | 24,569 | 24,981 | 1.7 | -18.5 |
| Semi-detached | 24,561 | 18,250 | 18,561 | 1.7 | -24.4 |
| Terraced | 30,784 | 21,709 | 21,308 | -1.8 | -30.8 |
| Flat | 64,446 | 37,006 | 36,813 | -0.5 | -42.9 |
| Scotland | 150,445 | 101,534 | 101,664 | 0.1 | -32.4 |
Average price
The analysis on average price and market value of residential property by house type has not been adjusted for sales that cannot be assigned to a house type.
Historic trends suggest that for different house types average prices increase by less than 1.0 per cent when figures are revised one year later and and more sales are assigned to a house type.
As the 2019-20 data is subject to change due to unassigned sales, caution should be applied when making comparisons with previous years (online table 10).
Detached properties had an average price of £271,010 in 2019-20, the highest of all house types. Semi-detached properties had the
second highest average price with £174,624.
The average prices of terraced and flatted properties were £148,605 and £139,395 respectively.
In 2019-20, the average price for each house type increased apart from flatted properties which decreased when compared with the
previous year.
Detached properties increased by 1.2 per cent, semi-detached by 2.7 per cent, terraced by 1.0 per cent and flatted decreased
by 1.2 per cent.
Between 2006-07 and 2019-20, the average price of detached properties increased by 24 per cent, semi-detached by 29 per cent,
terraced by 31 per cent and flatted by 21 per cent (chart 5).
Chart 5: Average residential property price by house type, Scotland, 2003-04 to 2019-20, financial year data (online table 10)

Market value
In 2019-20, the market value of detached properties was £6.1 billion, the largest share of the total value of residential property sales at 33 per cent.
Flatted properties, with a market value of £4.9 billion, had the second largest share of the property market (26 per cent).
Semi-detached and terraced properties both had a share of 16 per cent.
Sales unassigned to a house type accounted for 8.5 per cent of the total market value but we expect this figure to decrease as more sales are assigned to a house type (chart 6, online table 11).
Chart 6: Percentage of residential property sales market value by house type, Scotland, 2019-20, financial year data (online table 11)

Price band
In 2019-20, around four out of five (79 per cent) residential sales had a price between £20,000 and £250,000.
There has been a shift toward higher priced residential property from 2006-07 (peak year in terms of residential property sales) to
2019-20.
The volume of sales has increased in all price bands over £250,000, despite the overall volume of sales having decreased by 32 per cent between 2006-07 and 2019-20.
In contrast, the volume of sales in the ‘£20,000 - £145,000’ and ‘over £145,000 - £250,000’ price bands have decreased by 52 per cent and 17 per cent respectively.
Note that no account has been taken of inflation so a proportion of this shift will be due to inflationary effects in the property market and wider economy.
The share of sales transactions in the ‘£20,000 - £145,000’ price band has decreased from 64 per cent in 2006-07 to 45 per cent in 2019-20.
There has been an increase in market share in every price band over £145,000 from 2006-07 to 2019-20, ranging from a rise of
6.8 percentage points in the ‘over £250,000 - £325,000’ price band to 2.3 percentage points in the ‘over £425,000 - £1 million’ price band (chart 7, online table 12).
Chart 7: Percentage of residential property sales transactions by house price band, Scotland, 2006-07 and 2019-20, financial year data (online table 12)

The following analysis on price band by house type is based on the unadjusted sales figures, showing unassigned sales separately from house type figures and uses data from three financial years combined (2017-18 to 2019- 20).
Detached properties accounted for the largest proportion of sales in all price bands over £250,000 (53 per cent), while flatted properties accounted for the largest proportion of the ‘£20,000 - £145,000’ price band with a 50 per cent share.
In the ‘over £145,000 - £250,000’ price band, around a third of properties were detached with flatted and semi-detached properties having similar shares (both 24 per cent) (chart 8, online table 13).
Chart 8: Percentage of residential property sales transactions by house type and house price band, Scotland, 2017-18 to 2019-20 (3 financial years combined) (online table 13)

New build residential market
The figures presented in this section relate to single residential properties sold out of a builder’s development title.
The figures are therefore likely to cover the majority of new build transactions undertaken, but will exclude sales related to very small developments or single new build properties by private or small-scale builders.
Volume of sales
At 12,257 sales, new build sales were 34 per cent lower in 2019-20 than the pre-financial crisis peak level in 2007-08, when there were 18,536 new build sales from development titles.
This figure for 2019-20 is 69 sales more than the 12,188 sales registered in 2018-19 and continues the year-on-year increase in
volumes since the lowest point of the market in 2011-12, when there were 7,585 new build sales.
This year-on-year increase amounts to an increase of 4,672 sales (62 per cent) between 2011-12 and 2019-20 (chart 9, online table
14).
Of the 101,664 residential property sales in Scotland in 2019-20, 12.1 per cent were new builds. Although this share has not varied
greatly since 2003-04, this is the highest proportion since 2008-09.
New build property sales have accounted for more than 10.0 per cent of total residential property sales in Scotland since 2003-04, with a peak in proportion terms in 2008-09 (13.3 per cent) and a low in 2013-14 (10.1 per cent).
This proportion has increased each year since 2014-15.
Six local authority areas had higher volumes in 2019-20 than at the peak of the market in 2007-08.
These were:
- Argyll and Bute
- East Dunbartonshire
- East Lothian
- East Renfrewshire
- Midlothian
- Orkney Islands
Of these six, Argyll and Bute with 117 sales matched their previous highest volume of sales since 2003-04 and both East Lothian with 740 sales and East Renfrewshire with 324 sales exceeded their previous highest volumes.
Chart 9: Volume of new build residential property sales, Scotland, 2003-04 to 2019-20, financial year data(online table 14)

Charts 10 and 11 show the respective peak years for new build property sales in each local authority and the difference in new build sales between that peak year and 2019-20.
Argyll and Bute, East Lothian and East Renfrewshire, with their peak year in 2019-20, show zero difference, while Glasgow City, with its peak year in 2007-08 (2,920 sales), had 1,929 fewer sales in 2019-20 (991 sales).
| Local Authority | Abbreviation |
|---|---|
| Aberdeen City | AbC |
| Aberdeenshire | Abs |
| Angus | Ang |
| Argyll and Bute | ArB |
| City of Edinburgh | Edi |
| Clackmannanshire | Cla |
| Dumfries and Galloway | DuG |
| Dundee City | Dun |
| East Ayrshire | EAy |
| East Dunbartonshire | EDu |
| East Lothian | ELo |
| East Renfrewshire | ERe |
| Falkirk | Fal |
| Fife | Fif |
| Glasgow City | Gla |
| Highland | Hig |
| Inverclyde | Inv |
| Midlothian | Mid |
| Moray | Mor |
| Na h-Eileanan Siar | Na H |
| North Ayrshire | NAy |
| North Lanarkshire | NLa |
| Orkney Islands | Ork |
| Perth and Kinross | PeK |
| Renfrewshire | Ren |
| Scottish Borders | ScB |
| Shetland Islands | She |
| South Ayrshire | SAy |
| South Lanarkshire | SLa |
| Stirling | Sti |
| West Dunbartonshire | WDu |
| West Lothian | WLo |
Chart 10: Peak year for new build residential property sales in each local authority, Scotland, 2003-04 to 2019-20, financial year data (online table 15)

Chart 11: Change in volume of new build residential property sales in 2019-20 with local authority peak year by local authority, Scotland, financial year data (online table 15)

Average price
The average price for a new build residential property in Scotland in 2019-20 was £258,272, a 3.5 per cent increase when compared with the previous year (£249,656).
This continues the generally upward trend since 2009-10 where there has been an increase in each year apart from 2018-19 (chart 12, online table 15).
This figure for new build properties in 2019-20, compares with an average price of £182,357 for all residential properties.
In the last 10 years the average price for a new build residential property has increased by 34 per cent compared with 20 per cent for all residential properties.
Na h-Eileanan Siar, Shetland Islands, Orkney Islands and Clackmannanshire all showed average prices less than £187,218.
Local authority areas where sales volumes represent less than 1 per cent of the all-Scotland sales volume are excluded from the figures used for highlighting purposes.
Please see background and contact information section for further details.
The size of the increase in average price seen in new build properties over this time could in part be explained by the change in composition of house types built throughout the reporting period, which is explored further in the house type section below.
East Dunbartonshire showed the highest average price for a new build property in 2019-20 at £366,721, a 3.5 per cent increase
compared with the previous year.
East Renfrewshire had the second highest average price for a new build at £334,516.
This was a decrease of 15 per cent from the previous year and the first time that East Renfrewshire has not been the local authority with the highest average new build price.
The lowest average new build prices in 2019-20 were in Scottish Borders at £187,218 and in East Ayrshire at £196,347⁸.
Chart 12: Average residential property price for new builds and all residential properties, Scotland, 2003-04 to 2019-20, financial year data (online table 15)

Price band
Chart 13 shows the volume of new build residential sales in Scotland by price band as a percentage of the annual total of new build
sales, comparing 2019-20 with 2007-08 (the peak year for new build sales).
In 2019-20, three quarters (76 per cent) of all sales had sale prices between £145,000 and £325,000, with half (50 per cent) of all sales in 2019-20 in the ‘over £145,000 - £250,000’ price band (online table 17).
There has been a marked shift toward higher priced new build property from 2007-08 to 2019-20.
When comparing 2019-20 with both 2018-19 and 2007-08 an increase in volume was seen across all price bands for sales in
excess of £250,000.
There were 806 new build sales in 2019-20 which had a price greater than £425,000.
This compares with 533 sales at the height of the market in 2007-08 and 769 sales in 2018-19.
This contrasts with the fall in volume in the ‘£20,000 - £145,000’ price band, which has decreased over this time from 5,210
sales in 2007-08 to 1,032 sales in 2018-19 and 795 sales in 2019-20.
Since 2005-06 the share of the ‘over £145,000 - £250,000’ price band has remained relatively constant at around half of all new build sales.
In 2019-20, there were 36 new build sales for over £1 million, the highest since the start of this report in 2003-04.
Chart 13: Percentage of new build residential property sales transactions by house price band, Scotland, 2007-08 and 2019-20, financial year data (online table 17)

New build residential market value
The value of the new build residential property market in Scotland increased to £3.2 billion in 2019-20, a growth of 4.0 per cent compared with 2018-19.
This compares with an overall market value for all residential sales of £18.5 billion in 2019-20.
The new build residential market value has increased every year since 2011-12, reflecting increases in both number of sales and average prices across these years.
The value of the new build residential market in Scotland in 2019-20 was 15 per cent lower than the peak of £3.7 billion in 2007-08 and more than double the £1.5 billion that the residential new build market was worth in 2010-11 (chart 14, online table 18).
Online table 18 shows the value of the new build residential market by local authority.
City of Edinburgh continued to hold the largest market value of all the local authorities in Scotland, at £400 million this was a 1.0 per
cent rise on the £396 million it was worth in 2018-19 and equates to a share of 13 per cent of the total new build market value in
2019-20.
Apart from City of Edinburgh, four other local authority areas had values in 2019-20 of over £200 million.
These were South Lanarkshire with a value of £265 million and an 8.4 per cent share of the total market value, East Lothian with a value of £231 million and a 7.3 per cent share of the market, Glasgow City with a value of £224 million and a 7.1 per cent share of the market and North Lanarkshire at £216 million and 6.8 per cent market share.
Chart 14: Value of new build residential property sales, Scotland, 2003-04 to 2019-20, financial year data (online table 18)

House type
In Chapter 2, house type and price band, the volume of sales by house type is presented with unassigned sales allocated to house types using historic data.
This methodology cannot at this time be used for new build properties, so the following data and analyses are presented showing unassigned sales separately from the house type figures.
Online tables 19 to 20 detail the average price, sales volume and market value of the new build residential property market in Scotland by house type.
House type figures for 2019-20 are provisional at this stage, due to titles for which registration is yet to be completed.
The majority of sales in 2019-20 cannot at this stage be assigned to a house type.
Unassigned sales accounted for a third (33 per cent) of sales in 2019-20, but this typically decreases as applications are completed and more information becomes available (12 per cent in 2018-19, 7.3 per cent in 2017-18).
These unassigned sales could skew any resulting analysis, and so caution should be applied when making comparisons with earlier years.
The composition of house types of new build properties being built has changed across the reporting period.
Despite the number of new build properties not assigned to a house type in the most recent years, there seems to have been a move away from flatted properties, with an increased emphasis on the other house types.
In 2007-08, the share of the total volume of new build sales for flatted properties was 38 per cent (7,021 flatted sales), which
had more than halved by 2017-18, decreasing by 23 percentage points to 15 per cent (1,806 flatted sales) with this decrease being reflected in an increase almost equally split across the other house types (online table 20).
Across the period of this report from 2003-2004 to 2019-20 the average price of a new build property in Scotland, irrespective of house type, has been consistently higher than the average price of all properties of that type.
The difference in average price is substantially greater for flatted and terraced properties, with average prices in 2019-20 being respectively 53 per cent and 42 per cent higher.
This comparison does not take into consideration other factors, aside from house type, that may affect any differences between new build and all sales, such as the size and location of properties being sold, their energy efficiency, etc. (online table 22).
High value residential market
This section looks at residential sales more than £1 million⁹
There were 255 high value (over £1 million) sales in 2019-20, an increase of 80 sales compared with 2018-19.
This represented the highest volume of sales since 2003-04, when RoS data starts, and the highest since the previous peak of 229 sales in 2007-08.
The volume of sales for 2019-20 is just over five times the number of high value transactions compared with 2003-04.
High value residential property sales in 2019-20 accounted for 0.2 per cent of all residential property sales in Scotland (including sales less than £20,000 and over £1 million).
The City of Edinburgh local authority area consistently held around half of all sales over £1 million until 2017-18 when the city’s share increased to two thirds.
It accounted for a 72 per cent share of high value sales in 2019-20.
Compared with 2018-19, the number of high value sales in the City of Edinburgh in 2019-20 increased from 118 to 183.
The figure of 183 high value sales in 2019-20 is also the highest in a local authority since the 2007-08 peak which saw 124 sales.
Chart 15: Volume of residential property sales more than £1 million, Scotland, 2003-04 to 2019-20, financial year data (online table 23)
Table 3 (online table 24) shows the top 10 postal districts for high value (over £1 million) sales in Scotland for the time period from
2007-08 to 2019-20.
The top 10 postal districts are located in six local authority areas: City of Edinburgh, Aberdeen City, Glasgow City, East Dunbartonshire, East Lothian and Fife.
Compared with last year, EH13 and G74 no longer appear in the top 10 list and EH39 has been added.
Table 3: Top 10 postal districts by volume of residential property sales more than £1 million, Scotland, 2007-08 to 2019-20, financial years combined (online table 24)
| Postal district | Local authority | Volume of residential property sales | Average residential property price |
|---|---|---|---|
| EH3 | City of Edinburgh | 276 | 1,472,011 |
| EH10 | City of Edinburgh | 188 | 1,419,954 |
| EH4 | City of Edinburgh | 169 | 1,347,612 |
| EH9 | City of Edinburgh | 166 | 1,454,634 |
| EH12 | City of Edinburgh | 127 | 1,404,627 |
| AB15 | Aberdeen City | 98 | 1,412,042 |
| G12 | Glasgow City | 51 | 1,207,793 |
| G61 | East Dunbartonshire | 49 | 1,284,656 |
| EH39 | East Lothian | 47 | 1,366,311 |
| KY16 | Fife | 45 | 1,587,209 |
In 2019-20, the average price of a property in Scotland in the over £1 million price band was £1.45 million, representing an increase of 6.1 per cent compared with 2018-19 (chart 16, online table 25).
Chart 16: Average residential property price (for sales more than £1 million), Scotland, 2003-04 to 2019-20, financial year data (online table 25)

The most expensive residential property to be registered since 2003-04 was in East Lothian in 2006-07. This property, which sold for £5.0 million.
The most expensive residential property in a rural area (and overall in Scotland) in 2019-20 was in Perth and Kinross, selling for
£3.65 million.
In urban areas (and second most expensive residential property sale in 2019- 20), the most expensive residential property was in the City of Edinburgh, and sold for £3.5 million.
The value of the over £1 million market in 2003-04 was £62 million, rising to the previous peak of £322 million in 2007-08.
The market value in 2019-20, £369 million, is a new high and an increase of 55 per cent on 2018-19 (chart 17, online table 26).
Chart 17: Value of residential property sales more than £1 million, Scotland, 2003-04 to 2019-20, Scotland, financial year data (online table 26)

City residential market
This sections looks at Scotland's seven cities which are based on locality information from National Records of Scotland10.
Volume
In Scotland, 27 per cent of all residential properties sold in 2019-20 were located within one of Scotland’s seven cities.
The volume of residential sales in Scotland’s cities decreased by 3.3 per cent to 27,763 sales between 2018-19 and 2019-20, which was 44 per cent lower than the sales volume peak in 2006-07.
For Scotland as a whole, residential property sales increased by 0.1 per cent when compared with the previous year, and were 32
per cent below the level in 2006-07.
Excluding cities, the volume of residential sales across the rest of Scotland increased by 1.5 per cent between 2018-19 and 2019-20 to 73,901 sales, 27 per cent lower than the sales volume in 2006-07.
Residential property sales decreased in all cities between 2018-19 and 2019-20 while over the same period sales increased by 1.5 per cent in the rest of Scotland.
The volume of residential property sales in cities has increased by 24 per cent since the recent sales low in 2011-12.
This is slower growth than Scotland as a whole, which increased by 44 per cent between 2011-12 and 2019-20.
Sales in the rest of Scotland, excluding cities, increased by 54 per cent over the same period.
In 2019-20, Glasgow and Edinburgh accounted for 73 per cent of the volume of sales of all city residential properties and 20 per cent of all residential sales across Scotland.
Glasgow had the largest share of sales in Scottish cities in 2019-20 at 39 per cent, with Edinburgh on 34 per cent (chart 18).
The cities’ share of the total residential market across Scotland has followed a generally decreasing trend since 2003-04.
The share was 34 per cent in 2003-04 compared with 27 per cent in 2019-20.
Chart 18: Volume of city residential property sales by city, Scotland, 2003-04 to 2019-20, financial year data (online table 27)

Average price
The average price paid for a residential property within one of Scotland’s seven cities has slightly increased over the last year rising
from £194,164 in 2018-19 to £194,248 in 2019-20.
The city average price is 6.5 per cent above the average price for all of Scotland in 2019-20 (£182,357).
In 2019-20, the average price of every individual city other than Edinburgh is lower than the average price for Scotland (chart 19, online table 28).
In 2019-20, the average price in every city was financial year data (online table 28) above the pre-financial crisis level, with the exception of Aberdeen which was 4.1 per cent lower in 2019-20 than in 2007-08.
Chart 19: Average city residential property price by city, Scotland, 2003-04 to 2019-20, financial year data (online table 28)

Market value
The market value for residential sales in all seven cities for 2019-20 was £5.4 billion.
This was 35 per cent lower than the market value in 2007-08 (£8.3 billion) and 3.3 per cent lower than 2018-19 (£5.6 billion).
This compares with a residential market value of £18.5 billion across the whole of Scotland in 2019-20 (chart 20, online table 29).
House type
The sales volume for flatted properties decreased by 48 per cent from 34,329 to 18,017 sales between 2006-07 (peak year for
this house type) and 2019-20.
The average price of all house types in Scotland’s cities have all increased by a similar amount between the pre-financial crash level
in 2007-08 and 2019-20 (13 per cent to 17 per cent).
The average price for every house type in Scotland’s cities is markedly higher than for Scotland as a whole.
The average price for terraced properties in 2019-20 is 42 per cent higher within cities than the Scotland average, with detached, semi-detached and flatted properties all between 21 and 25 per cent higher.
Chart 20: Percentage of city residential property sales transactions and market value by city, Scotland, 2019-20, financial year data (online tables 27 and 29)

City highlights
Aberdeen
The volume of sales in Aberdeen decreased in the last year by 7.3 per cent to 2,745 sales in 2019-20.
This volume was 60 per cent lower than the volume in 2006-07, the peak sales volume year for Aberdeen.
Aberdeen was one of only two cities to see a decrease in the average residential property price between 2018-19 and 2019-20, a 4.9 per cent decrease on the previous year to £166,649.
Out of all Scottish cities, Aberdeen showed the only decrease since the prefinancial crash level in 2007-08, with a 4.1 per cent drop.
The highest average price in Aberdeen over the period was £205,101 in 2014-15.
Overall, average prices in Aberdeen have increased by 87 per cent between 2003- 04 and 2019-20.
In 2019-20, the market value of residential property sales in Aberdeen was £457 million.
This was a decrease of 12 per cent on the previous year, and 60 per cent lower than the market value in 2007-08 (£1.1 billion), the largest decreases in market value when compared with all cities over both time periods.
Aberdeen remained the third largest residential sales market in Scotland in 2019-20 after Edinburgh and Glasgow.
Dundee
In Dundee, the average price of a residential property for 2019-20 was £139,172, up 2.0 per cent on 2018-19.
The average purchase price in Dundee rose above the pre-financial crisis level of 2007-08 for the first time in 2017-18, and in 2019-20 was 6.3 per cent higher than the average price in 2007-08.
Only flatted properties saw a decrease in average price between 2018-19 and 2019-20, with all other house types increasing over this time.
Dundee saw a decrease in volume of sales from 2018-19 to 2019-20, decreasing by 2.4 per cent to 2,396.
This figure was 33 per cent higher than the recent lowest point in the market in 2011-12, but 43 per cent lower than the sales volume in 2007-08.
In 2019-20, the market value of Dundee residential property sales was £333 million, which was a decrease of 0.5 per cent from the
previous year.
The market value in Dundee increased by 52 per cent since the lowest point in 2011-12 but remains 39 per cent lower than
the market value in 2007-08.
Edinburgh
In 2019-20, Edinburgh had the highest residential market value of all of Scotland’s cities, at £2.5 billion.
This was a decrease of 4.3 per cent on the previous year, and 24 per cent lower than the residential market value in 2007-08.
Edinburgh represented 47 per cent of the residential market value of all cities, no change from 2018-19, compared with 40 per
cent in 2007-08.
Edinburgh accounted for 14 per cent of the market value of the whole of Scotland in 2019-20.
Edinburgh had a decrease in the volume of residential sales over the last year, falling by 4.3 per cent to 9,521 sales.
The volume of sales in Edinburgh was 41 per cent lower than the volume in 2006-07, the peak year for sales in Edinburgh.
The average residential property price in Edinburgh in 2019-20 was £264,098.
This was a slight increase on the previous year and a 22 per cent increase on 2007-08.
The average price of a detached property in Edinburgh in 2019-20 was £446,993, down 2.1 per cent from the previous year and up 11 per cent on 2007-08.
This was the highest average price of any house type across all seven cities in 2019-20, the closest in any city being a detached property in Aberdeen (£330,321).
Glasgow
Glasgow’s property market was worth £1.7 billion in 2019-20, the only city to show an increase rising 0.7 per cent when compared
with 2018-19, and a decrease of 38 per cent on 2007-08.
The value of residential property sales in Glasgow has increased by 77 per cent since its recent lowest point in 2012-13.
Glasgow represented 32 per cent of the residential market value of all cities in 2019-20, a decrease of one percentage point when
compared with 2007-08.
This proportion has increased every year since 2013-14 when Glasgow accounted for 24 per cent of the all city market value.
In 2019-20 the average price in Glasgow was £158,565, an increase of 1.7 per cent on the previous year and 11 per cent on 2007-08.
Only detached properties saw a decrease in average price between 2018-19 and 2019-20, with all other house types increasing over this time.
With 10,823 residential sales in 2019-20, Glasgow had the largest volume of sales of the seven cities.
This equates to 11 per cent of all 2019-20 residential sales in Scotland.
The volume of sales in Glasgow decreased by 0.9 per cent between 2018-19 and 2019-20, but have increased by 44 per cent since 2011-12, when there were 7,542 sales.
Inverness
The average house price in Inverness for 2019-20 was £170,803, the second highest average house price in Scotland’s cities after Edinburgh.
The average price in 2019-20 was 1.7 per cent lower than the average price in 2018-19, and 8.8 per cent higher than the average
price in 2007-08.
Only flatted properties saw a decrease in average price between 2007-08 and 2019-20, with all other house types increasing over this time.
The volume of sales decreased by 4.3 per cent from the previous year with 869 sales in 2019-20 compared with 908 in 2018-19.
The volume of sales in Inverness in 2019-20 was 45 per cent lower than the volume in 2005-06, the peak sales year for Inverness, when there were 1,590 sales.
The value of the residential market in Inverness decreased by 6.0 per cent between 2018-19 and 2019-20 to £148 million.
The market value of Inverness was 38 per cent lower than in 2007-08 (£241 million).
Perth
The average residential property price for Perth in 2019-20 was £152,435, a 1.8 per cent increase when compared with 2018-19 and
also showed an increase of 12 per cent when compared with 2007-08.
The average price of flatted properties decreased between 2007-08 and 2019-20, while all other house types increased over this period.
The volume of sales in Perth decreased by 7.6 per cent between 2018-19 and 2019-20 to 785 sales.
Residential property sales in 2019-20 were 51 per cent lower than residential property sales in 2006-07, when there were 1,586 sales.
The market value in Perth decreased by 6.0 per cent in the last year and showed a 42 per cent decrease since 2007-08.
Stirling
The average residential house price in Stirling in 2019-20 was £165,499, a 4.3 per cent increase on the previous year and a 3.5 per
cent increase on 2007-08 (£159,871).
In the last year, detached sales were the only house type to show a decrease in average price dropping 0.7 per cent.
The volume of sales in Stirling decreased by 7.7 per cent between 2018-19 and 2019-20, the largest fall of all cities.
The 624 sales recorded in Stirling in 2019-20 was 38 per cent lower than in 2004-05, the peak year for sales in Stirling.
In 2019-20, the value of the residential market in Stirling decreased by 3.7 per cent to £103 million when compared with the previous year.
This was 33 per cent lower than the market value in 2007-08, the second smallest decrease of all cities over this period.
Mortgage market
This section looks at the volume of residential sales with a mortgage and the volume of residential sales with cash sales.
In 2019-20, sales with a mortgage accounted for 70 per cent of the residential sales market, with cash sales accounting for the balance.
This proportion has remained relatively constant since 2012-13. Prior to that, the proportion of sales with a mortgage decreased from 84 per cent in 2007-08 to 70 per cent in 2012-13 as a result of more restricted lending conditions in place following the financial crisis.
In 2003-04, 81 per cent of residential sales were with a mortgage (chart 21, online table 30).
The volume of residential sales with a mortgage has decreased by 44 per cent from 125,999 in 2007-08 (peak year for mortgage
sales) to 70,724 in 2019-20.
Residential purchases registered without a mortgage (cash sales), as a proportion of all residential sales, was 16 per cent in 2007-08 compared with 30 per cent in 2019-20, an increase of 34 per cent from 23,133 to 30,940.
This compares with a decrease in the volume of residential sales of 32 per cent between 2007-08 and 2019-20, which was in large part due to substantial decreases in the years immediately following the financial crisis in 2007-08.
The volume of residential sales registered with an accompanying mortgage more than halved between 2007-08 and 2009-10, a decrease of 58 per cent.
Between 2011-12 and 2019-20, the volume of sales with mortgages has followed a generally increasing trend, rising by 41 per cent from 50,179 to 70,724 sales.
The volume of cash sales decreased by 21 per cent between 2007-08 and 2008-09.
The number of cash sales increased every year to 31,451 in 2017-18.
Cash sales decreased year-on-year in 2018-19 and 2019-20 to 31,339 and 30,940.
In 2019-20, the volume of cash sales is 20 per cent higher than the pre-financial crisis peak in 2006-07.
Chart 21: Percentage of residential property sales transactions by funding status, Scotland, 2003-04 to 2019-20, financial year data (online table 30)

Na h-Eileanan Siar and Argyll and Bute saw the highest proportion of cash sales of all local authority areas in 2019-20, where around 50 per cent of all residential sales were cash sales.
The lowest proportion with cash sales was in West Lothian accounting for 19 per cent of residential sales (chart 22, online table 31).
Chart 22: Cash residential property sales as a percentage of residential property sales by local authority, Scotland, 2019-20, financial year data (online table 31)

Price bands
In 2019-20, four out of five (79 per cent) residential sales with a mortgage had an average price between £20,000 and £250,000.
The volume of residential mortgage sales in the ‘£20,000 to £145,000’ and ‘over £145,000 to £250,000’ price bands between 2007-08 (peak year in terms of residential mortgage sales) and 2019-20 have decreased by 60 per cent and 33 per cent respectively.
There has been a shift toward mortgage sales with a higher value over the same period.
The volume of mortgage sales over £250,000 has increased, despite the overall volume of mortgage sales having decreased by 44 per cent between 2007-08 and 2019-20.
The share of mortgage sales transactions in the ‘£20,000 to £145,000’ price band has decreased from 59 per cent in 2007-08 to 42 per cent in 2019-20.
There has been an increase in share in every price band over £145,000 from 2007-08 to 2019-20, ranging from a rise of 6.4 percentage points in the ‘over £250,000 to £325,000’ price band to 1.7 percentage points in the ‘over £425,000 to £1 million’ price band (chart 23, online table 32).
Chart 23: Percentage of residential property sales transactions with mortgage by house price band, Scotland, 2007-08 and 2019-20, financial year data (online table 32)

In 2019-20, over half (53 per cent) of all cash sales had an average price in the ‘£20,000 to £145,000’ price band.
There has been a shift toward cash sales with a higher value from 2007-08 to 2019-20.
The volume of cash sales has increased in all price bands over this time, despite the fall in overall volume of all residential sales.
While cash sales of up to £250,000 have increased by 26 per cent between 2007-08 and 2019-20, the volume of cash sales over £250,000 has increased by 79 per cent.
The largest increase was seen in the ‘over £250,000 to £325,000’ price band with an 88 per cent increase between 2007-08 and 2019-20.
The share of cash sales transactions in the ‘over £145,000 to £250,000’ price band has decreased from 34 per cent in 2007-08 to
27 per cent in 2019-20.
There has been an increase in market share in every price band over £250,000 from 2007-08 to 2019-20 (chart 24, online table 32).
Chart 24: Percentage of residential property cash sales transactions by house price band, Scotland, 2007-08 and 2019-20, financial year data (online table 32)

Remortgage/additional borrowing
The volume of lending for remortgage/additional borrowing¹¹ for all property types, not just residential, decreased by 75 per cent from 92,958 securities in 2007-08 (peak year in terms of the remortgage/additional borrowing market) to 23,588 in 2014-15 (lowest point).
From this low point, the volume has increased year-on-year with a 7.6 per cent rise between 2018-19 and 2019-20 to 53,769 securities (chart 25, online table 33).
Overall, the volume of all mortgage securities registered by RoS across all property types, including both mortgage sales and additional borrowing, increased by 3.7 per cent in the last year, up from 131,283 in 2018-19 to 136,111 in 2019-20.
This figure is down by 49 per cent when compared with 2006-07, when there were 264,656 securities registered in the Land Register.
Chart 25: Volume of property related securities by type of borrowing, Scotland, 2003-04 to 2019-20, financial year data (online table 33)

Interest rates
This section contains commentary and figures relating to the whole of the UK and not just Scotland.
The Bank of England official interest rate decreased from 5.75 per cent in July 2007 to 0.5 per cent in March 2009.
In August 2016, the interest rate was changed to 0.25 per cent, increased to 0.5 per cent in November 2017 and 0.75 per cent in August 2018.
In March 2020, in response to coronavirus, the interest rate was changed twice, first on 11 March to 0.25 per cent and second on 19 March to 0.1 per cent.
The mortgage market has not only been influenced by decreasing interest rates over the reporting period, but also by changes in the
behaviour of lenders.
The Financial Conduct Authority (FCA) discuss in their Data Bulletin (published December 2017) the “significant decline in very high loan to value (LTV) mortgage advances following the financial crisis”.
The FCA details that in 2007, 14 per cent (290,000 loans) of all mortgages had an LTV of over 90 per cent, which had reduced to just 1 per cent (12,000 loans) by 2011.
A gradual increase from 2014 onwards resulted in the proportion of mortgages with an LTV over 90 per cent rising to 9 per cent (101,000 loans).
Mortgages with an LTV over 95 per cent fell from 5 per cent of the total in 2007 to 0.4 per cent in 2016.
In 2019-20, the percentage of mortgages with an LTV over 95 percent was around 0.3 per cent.
The Bank of England in their Monetary Policy Report show that coronavirus has also affected lending capacity in the mortgage market.
For new mortgage availability, lenders have been affected by staff shortages and the availability of products with higher LTVs (over 90 per cent) has fallen sharply at the end of March and in April 2020.
Non-residential market
Our non-residential overview covers commercial sales, commercial leases, and sales of titles that are classified as forestry, agriculture and land12.
The total market value of all types of nonresidential sales in 2019-20 was £3.7 billion (table 4).
RoS has collected relevant data on land classes covering forestry and agriculture since December 2014.
Prior to that, non-residential sales were only classified as commercial or land, so sales of forestry or agriculture will previously have been included within either of these classifications.
Commercial sales13
The value of the commercial sales market in Scotland in 2019-20 was £3.0 billion, down by 7.6 per cent on 2018-19 and 86 per cent
higher than the £1.6 billion it was worth in 2012-13 (the lowest point of the market in terms of value across the period).
The market value in 2019-20 was 51 per cent lower than in 2006-07 (the market’s peak) and this was also the lowest value since 2013-14.
In 2019-20, commercial sales made up 81 per cent of the market value of all non-residential sales (chart 26, table 4 and online table 40).
The volume of commercial sales in 2019-20 remains 23 per cent lower than the sales peak (5,392 sales) in 2007-08.
Since the lowest point in 2012-13 (2,663 sales), sales have increased by 56 per cent to 4,156 sales in 2019-20.
Until this year, increases in volume had been seen every year since 2013-14, and this year has shown the lowest volumes since 2015-16 (online table 35).
Chart 26: Value of commercial sales, Scotland, 2003-04 to 2019-20, financial year data (online table 35)

Value of city commercial sales
The city commercial market value in 2019-20 was £1.8 billion, an increase of 2.5 per cent on 2018-19 and more than double the market value of £887 million in 2012-13, the lowest point in terms of value across the period.
The 2019-20 value remains 46 per cent lower than the £3.4 billion market value in 2006-0714.
In 2019-20 the value of the city commercial market equated to around three-fifths (61 per cent) of the all Scotland commercial sales total (chart 27, online table 36).
Edinburgh and Glasgow, Scotland’s two largest cities, between them made up £1.5 billion, over four-fifths (82 per cent) of the total city market value (£1.8 billion).
Since 2012-13, the lowest point in terms of value, six of the seven cities have shown a growth in the market value of commercial sales.
This growth ranges widely, from Stirling, which had a market value of £32 million in 2019-20, a figure that was more than seven times greater than the market value of £4.4 million in 2012-13, to Aberdeen which saw an increase of 27 per cent over the same time period.
Perth was the only city to have seen a decline in market value since 2012-13, dropping 3.8 per cent from £19 million in 2012-13 to £18 million in 2019-20.
Three out of the seven cities saw the market value of their commercial sales increase in 2019-20 when compared with 2018-19,
Edinburgh increased by 6.8 per cent, Glasgow by 6.5 per cent and Stirling by 7.6 per cent.
The largest fall in market value was in Dundee, which, with a market value of £92 million in 2019-20, was 29 per cent lower than the value of £130 million recorded in 2018-19.
The annual volume of commercial sales in the seven cities for 2019-20 was 1,247, down by 13 per cent on 2018-19.
This was 49 per cent higher than the lowest recorded volume of commercial sales, which was 838 sales in 2011-12.
The 2019-20 figure was 38 per cent less than the 2,009 sales recorded at the height of the market in 2006-07 (online table 37).
Chart 27: Value of city commercial sales by city, Scotland, 2003-04 to 2019-20, financial year data (online table 36)

Perth and Stirling showed an increase in volumes in 2019-20 when compared with 2018-19, with increases of 18 per cent and 30 per cent respectively.
All other cities showed a decrease, with Dundee having the largest percentage decrease in volume in 2019-20, down by 36 per cent from 2018-19.
In 2019-20, apart from Aberdeen with a 7.6 per cent decrease in volume, all cities showed an increase from 2011-12 which was the
period with the lowest recorded volume of commercial sales across Scotland.
There were 125 per cent more commercial sales in Dundee and 152 per cent more in Perth in 2019-20 than in 2011-12.
Stirling was the only city to show an increase when comparing 2019-20 with 2006-07 (peak year for city commercial sales transactions), with sales volumes increasing by 44 per cent.
Glasgow had the highest volume of city commercial sales both in 2019-20 and in every year during the period of this report.
There were 458 sales in 2019-20, 37 per cent of all city commercial sales (chart 28, online table 37).
Chart 28: Percentage of city commercial sales transactions by city, Scotland, 2019-20, financial year data (online table 37)

Commercial leases15
lowest number of assignations registered during the period of this report (online table 39).
Forestry, agriculture and land
Table 4: Summary of non-residential market, Scotland, 2019-20, financial year data (online table 40)
| Volume of sales | Average price (£) | Market value (£ million) | Market value as % of non-residential total | |
|---|---|---|---|---|
| Forestry | 136 | 668,805 | 91 | 2.4% |
| Agriculture | 499 | 468,548 | 234 | 6.3% |
| Land | 2,677 | 144,779 | 388 | 10.4% |
| Total: foresty, agriculture, land | 3,312 | 215,077 | 712 | 19.1% |
| Commercial | 4,156 | 727,876 | 3,025 | 80.9% |
| Non-residential total | 7,468 | 500,454 | 3,737 | 100% |
South Lanarkshire recorded the largest annual market value for forestry sales in 2019-20, with a value of £16 million, this was 18 per cent of the total forestry market value.
Dumfries and Galloway and Highland shared the highest volume of sales both with 19 sales each (online tables 41 and 42).
The market value of agricultural sales in 2019-20 was £234 million, down by 25 per cent from 2018-19 which, with a market value of £312 million, the largest market value of the five years for which data is available.
In 2019-20, agricultural sales made up 6.3 per cent of the market value of all non-residential sales.
The volume of agricultural sales in 2019-20 was 499 sales, a drop of 19 per cent on the 618 sales registered in 2018-19 which was
the year with the largest volume of sales in the period of this report.
As has been the case in each of previous five years, Aberdeenshire had the largest agricultural market value in 2019-20 at £38 million, which was 35 per cent less than 2018-19 and was also the local authority with the highest volume of agricultural sales
transactions in 2019-20 with 94 sales (online tables 43 and 44).
Titles registered under the category of land are the most common non-residential sale type after commercial, with a volume of 2,677
registered in 2019-20.
There was a decrease of 4.3 per cent in the number of sales when compared with 2018-19, with a volume of 2,797 registered in that year.
The market value of land sales for 2019-20 was £388 million, a 1.8 per cent decrease on the £395 million market value in 2018-19.
In 2019-20 land sales made up 10 per cent of the market value of all non-residential sales.
Highland was the local authority area with the largest volume of transactions in 2019-20 with 349 land sales.
The greatest market value of 2019-20 was South Lanarkshire with £32 million, a 47 per cent growth in market value when compared with 2018-19 (online tables 45 and 46).
Residential Property Sales By Urban Rural Classification
A small number of residential property sales could not be classified to an urban rural classification due to having no seed point or
having a postcode which was not contained in the urban rural look-up tables.
The proportion of unclassified titles was 6.5 per cent for Scotland, varying between no unclassified in Orkney Islands and 16 per cent in East Lothian (online table 47).
Volume of residential property sales
In 2018-20, 81 per cent of residential property sales in Scotland were in urban areas and 19 per cent in rural areas (chart 29, online table 47).
For context, in terms of land area, urban areas account for 2.2 per cent of Scotland and rural areas account for 97.8 per cent.
In terms of population, urban areas account for 83 per cent and rural areas account for 17 per cent.
Residential property sales in large urban areas accounted for 37 per cent of total residential sales in Scotland.
Other urban areas accounted for 27 per cent, 7.8 per cent in accessible small towns, 2.2 per cent in remote small towns and 1.1 per cent in very remote small towns.
Residential property sales in accessible rural areas accounted for 12 per cent of total residential sales in Scotland, 3.1 per cent were
in remote rural areas and 2.8 per cent in very remote rural areas.
Chart 29: Percentage of residential property sales by 8-fold urban rural classification 2016, Scotland, 2018-20, two financial years combined (online table 47)

Glasgow City and Dundee City have a high land area percentage that is urban (87 per cent and 83 per cent urban respectively) and the focus of residential sales in 2018-20 within these local authorities is in urban areas (99 per cent and 97 per cent respectively, excluding unclassified).
The percentage of land area that is urban is relatively lower in City of Edinburgh and Aberdeen City (51 per cent and 46 per cent urban respectively) but residential sales in 2019-20 remain nearly all in urban areas (97 per cent and 95 per cent).
The chart shows that for local authorities with a lower percentage of urban land area (between 15 per cent and 30 per cent) the
percentage residential sales in urban areas remains high (between 86 per cent and 98 per cent) (chart 30, online tables 47 and 48).
Chart 30: Percentage of land area that is urban (SG UR 2016, 2-fold) compared with percentage of residential property sales in urban areas, local authority, 2018-20, two financial years combined** (online tables 47 and 48)

Average residential property price
The average price of a residential property in urban areas of Scotland in 2018-20 was £167,313 compared with £210,754 in rural areas.
Accessible rural areas are on average the most expensive area to purchase a property (£220,452) and very remote small towns are
the least expensive (£134,038) (chart 31 and online table 49).
Chart 31: Average residential property price by 8-fold urban rural classification 2016, Scotland, 2018-20, two financial years combined (online table 49)

In 2018-20 the highest average residential property price in urban areas of Scotland was in the City of Edinburgh (£263,478) and the highest average residential property prices in rural areas was in East Renfrewshire (£327,772).
The lowest average residential property price in urban areas was in East Ayrshire (£106,780) and in rural areas in Na h-Eileanan Siar (£121,440).
The average residential property price in East Ayrshire was 35 per cent higher in rural areas than in urban areas.
Chart 32: Average residential property price by 2-fold urban rural classification 2016, local authority, 2018-20, two financial years combined (online table 50)

Background and contact information
Registers of Scotland (RoS) records and safeguards information on all property sales through our land register, making us the
sole authority for complete property data in Scotland.
Official Statistics publication for Scotland
This is an official statistics publication for Scotland.
The statistics presented here on the property market in Scotland have been produced in line with the principles set out in the Code of Practice for Statistics.
Responsible statistician: Rachael Fairley
Email: Rachael.Fairley@ros.gov.uk
Contact number: 07919570915
Authors:
- Ailsa Robertson
- Euan Nelson
- Leeanne Welsh
- Robyn Logue
- Samuel Dickinson
- Sandra Smith
- the Land and Property Data Team at RoS
Reporting period
The reporting period is 1 April 2003 to 31 March 2020.
RoS has been producing property statistics for Scotland since April 2003, following the transfer of all Scottish registration counties to the Land Register of Scotland from the historic, deeds-based General Register of Sasines, which was established in 1617.
Registers of Scotland data
The statistics in this report are based on data derived from applications for registration received by RoS.
Registrations normally take place within a few weeks from the date of the completion of the sale.
The data is extracted based on the date of registration, i.e. the date that the application for registration is received by RoS, rather than on the date of entry contained within the application.
The base data is comprehensive, capturing all changes of ownership, including cash sales i.e. without a mortgage.
This base data is then subject to quality assurance to ensure that only appropriate data is included in the statistics.
Further information about the quality processes in place for RoS data is available in the quality assurance of administrative data document, as published for the UK House Price Index.
Coronavirus (COVID-19)
The data for 2019-20 has been affected by the coronavirus (COVID-19) pandemic.
The introduction of government measures to reduce the spread of coronavirus has meant fewer transactions were received by RoS than expected in March 2020.
These measures included the UK lockdown announcement on Monday 23 March, the temporary closure of the application record by RoS from Wednesday 25 March and the advice from the Scottish Government to delay moving home wherever possible.
Caution should be applied when interpreting data for 2019-20 and making comparisons with previous years.
More information is provided below on the effect of the coronavirus on 2019-20 data.
The number of residential property sales registered with RoS in March 2020 was 5,765, a 14 per cent decrease when compared with
March 2019. With the announcement of coronavirus measures, daily sales registered in March 2020 fell to single figures from 27
March 2020.
This compares with the previous 3-year March weekday average (2017, 2018 and 2019) of 317 residential property sales per weekday.
Residential property sales in 2019-20 were 0.1 per cent higher than in 2018-19.
Chart 33 shows the number of residential property sales by month between 2016-17 and 2019-20.
Sales between April 2019 and February 2020 were 1.1 per cent higher than the same period in the previous year.
Historically, as can be seen in chart 33, there is a seasonal pattern with residential property sales, with March sales usually higher than sales in January or February.
Therefore, fewer transactions than expected were registered in March 2020 and, overall, the small increase in sales in 2019-20 compared with 2018-19 would likely have been higher.
When looking at the whole financial year, statistics on the average residential property price are unlikely to be affected.
Coronavirus measures were introduced at the very end of the financial year and transaction prices were likely agreed before measures were put in place.
Any additional analysis on the impact of coronavirus on the Scottish property market will be published in our monthly statistics.
Chart 33: Volume of residential property sales by month, Scotland, 2016-17 to 2019-20, financial year data (online table 51)

Residential property sales
In relation to residential sales, only properties with a sale price of between £20,000 and £1,000,000 are included in the average house price statistics, volume of sales and total value of sales.
Registrations with a value of over £1 million are excluded to ensure that a single large value sale does not distort the average.
Sales of a block of properties that have been identified from the existence of multiple addresses in a title are also excluded.
Similarly, registrations with a value of less than £20,000 are excluded from the calculation to ensure that, as far as practical, a low value sale, or the sale of a part of the title to a residential property, does not distort the average.
The sale of a part of a title may happen when one of the joint owners of a shared property buys out the share of the other owner.
In 2019-20, there were 102,225 residential property sales across all price bands (including those less than £20,000 and over £1 million), of which 101,664 had a sale price between £20,000 and £1,000,000.
The dataset aims to exclude "non-true" sales e.g. transfer of ownership between family members, sales of a share of a property (e.g. one-half or one-third).
Council Right-to-Buy sales and sales by mortgage companies exercising their power of sale are difficult to identify, but where identified they are excluded as a potential sale of less than market value.
However, the majority are likely to be included. As the Right-to-Buy scheme has now ended, we expect the number of sales affected in this way to be minimal.
Although the residential property statistics include general data on house types, they are not seasonally adjusted or mix adjusted.
The house type data is produced using a house price classification system developed by RoS, which identifies properties as detached, semidetached, terraced or flat.
Our house type methodology means that it is not yet possible to allocate every property sale to a house type, which are labelled as ‘unassigned sales’.
For the latest statistics, a substantial number of sales cannot be assigned to a house type.
A provisional label is, therefore, applied to the latest two financial years.
The provisional label is used to caution users when using the latest house type statistics given the number of sales that remain
unassigned.
Full information on the methodology used to compile these statistics can be found on our website.
High value residential property sales
High value sales are residential property sales with a price of over £1 million.
Non-residential property sales and commercial leases
Non-residential property sales comprise all property sales classified as ‘commercial’, ‘forestry’, ‘agriculture’ or ‘land’ when registered with RoS.
RoS has collected relevant data on land classes covering forestry and agriculture since December 2014.
Prior to that nonresidential sales were only classified as commercial or land, so sales of forestry or agriculture will have been included within either of these classifications.
There is also an additional classification of ‘other’, covering ad hoc sales such as garages and sub-stations, which has not been included in this report.
Commercial leases comprise only those capable of being registered in the land register (with a term, or potential term, in excess of 20 years).
Cities
Cities are defined using locality data produced by the National Records of Scotland (NRS) and not a local authority area with the same or similar name.
The NRS data identifies the built up area of a town or city. Figures quoted for specific cities will therefore not match that of the associated local authority.
Urban Rural Classification¹
The Scottish Government urban rural classification 2016 was attached to all residential property sales in 2018-19 and 2019-20 using the 8-fold classification.
The urban rural classification given to each title was calculated by overlaying the title seed point (a point marker used to identify the position of a Land Register title on the Ordnance Survey base map) with the Scottish Government’s urban rural classification 2016.
Each seed point was classified with the values of the 2-fold classification extracted from the underlying urban rural classification
polygon.
View further information on the Scottish Government’s urban rural classification.
Land Register completion
View further information about our progress to move land and properties from the deeds based General Register of Sasines to the mapbased Land Register by 2024.
Revisions
The statistics included in this publication are revised annually when the full financial year time series is revised.
These statistics could differ from other RoS statistics as they have been extracted from a live database at a different point in time and are not subject to scheduled revisions throughout the year.
The data in this publication, therefore, may not always be the most up-to-date.
Contact information
Contact the Land and Property Data Team at RoS with any questions, comments or feedback.
Land & Property Data Team
Email: data@ros.gov.uk
RoS provides a wide range of land and property data services, including statistical reports and publications.
View further information about these services.
Sources
Unless stated otherwise, all statistics are based on RoS data.
Crown Copyright
You may use or reuse this information (not including logos) free of charge in any format or medium, under the Open Government
Licence.
If you use or publish this data, please acknowledge the data as Crown copyright and Registers of Scotland as the source, and add
the following attribution statement:
Contains Registers of Scotland data © Crown copyright and database right 2020.
This data is licensed under the Open Government Licence v3.0.